Black carbon and other pollution seeds clouds. We’re just starting to understand the climate implications

Black carbon and other pollution seeds clouds. We’re just starting to understand the climate implications

Particles swirling around our atmosphere add to climate change, yet much about how they interact with sunlight and influence the seeding of clouds remains puzzling. Studies are lifting the lid on how these tiny particles influence something as big as climate by analysing them from jet aircraftsatellites and ground measurements. 

The leading cause of climate change is rising levels of carbon dioxide in the atmosphere. This rise has been happening since the start of the Industrial Revolution and we now know a lot about how this gas behaves, traps heat and warms the Earth. 

A far more mysterious influence on climate comes from particles – or aerosols – suspended in air. Especially important is black carbon, the soot wafting off from burning vegetation and traffic fumes. This black stuff ranks as the second largest contributor to climate change. But it is very different from carbon dioxide. 

While carbon dioxide stays in the air for hundreds of years, black carbon lives on for just weeks in the atmosphere, explained Professor Bernadett Weinzierl, atmospheric and aerosol scientist at the University of Vienna, Austria.  

Carbon dioxide is a gas that mixes so well that its concentrations are pretty much the same over Naples as over Hawaii. On the other hand, the quantity and type of aerosol particles in the atmosphere vary depending on where you look. 

The effects of particle types differ too. Black carbon absorbs heat and causes the air to warm. Mineral dust absorbs light, but not as strongly. Some other particles reflect light away from the Earth. Scientists must carry out a bookkeeping exercise, totting up how much some particles warm the Earth, subtracting how much others cool our planet. 

Complicating the picture, particles seed the water droplets that eventually make up clouds. The types of particles influence the properties of those clouds.  

Pollutants 

Prof. Weinzierl tracks man-made pollutants and natural particles like dust from deserts in the atmosphere in a project called A-LIFE 

Black carbon and other pollution seeds clouds. We’re just starting to understand the climate implications
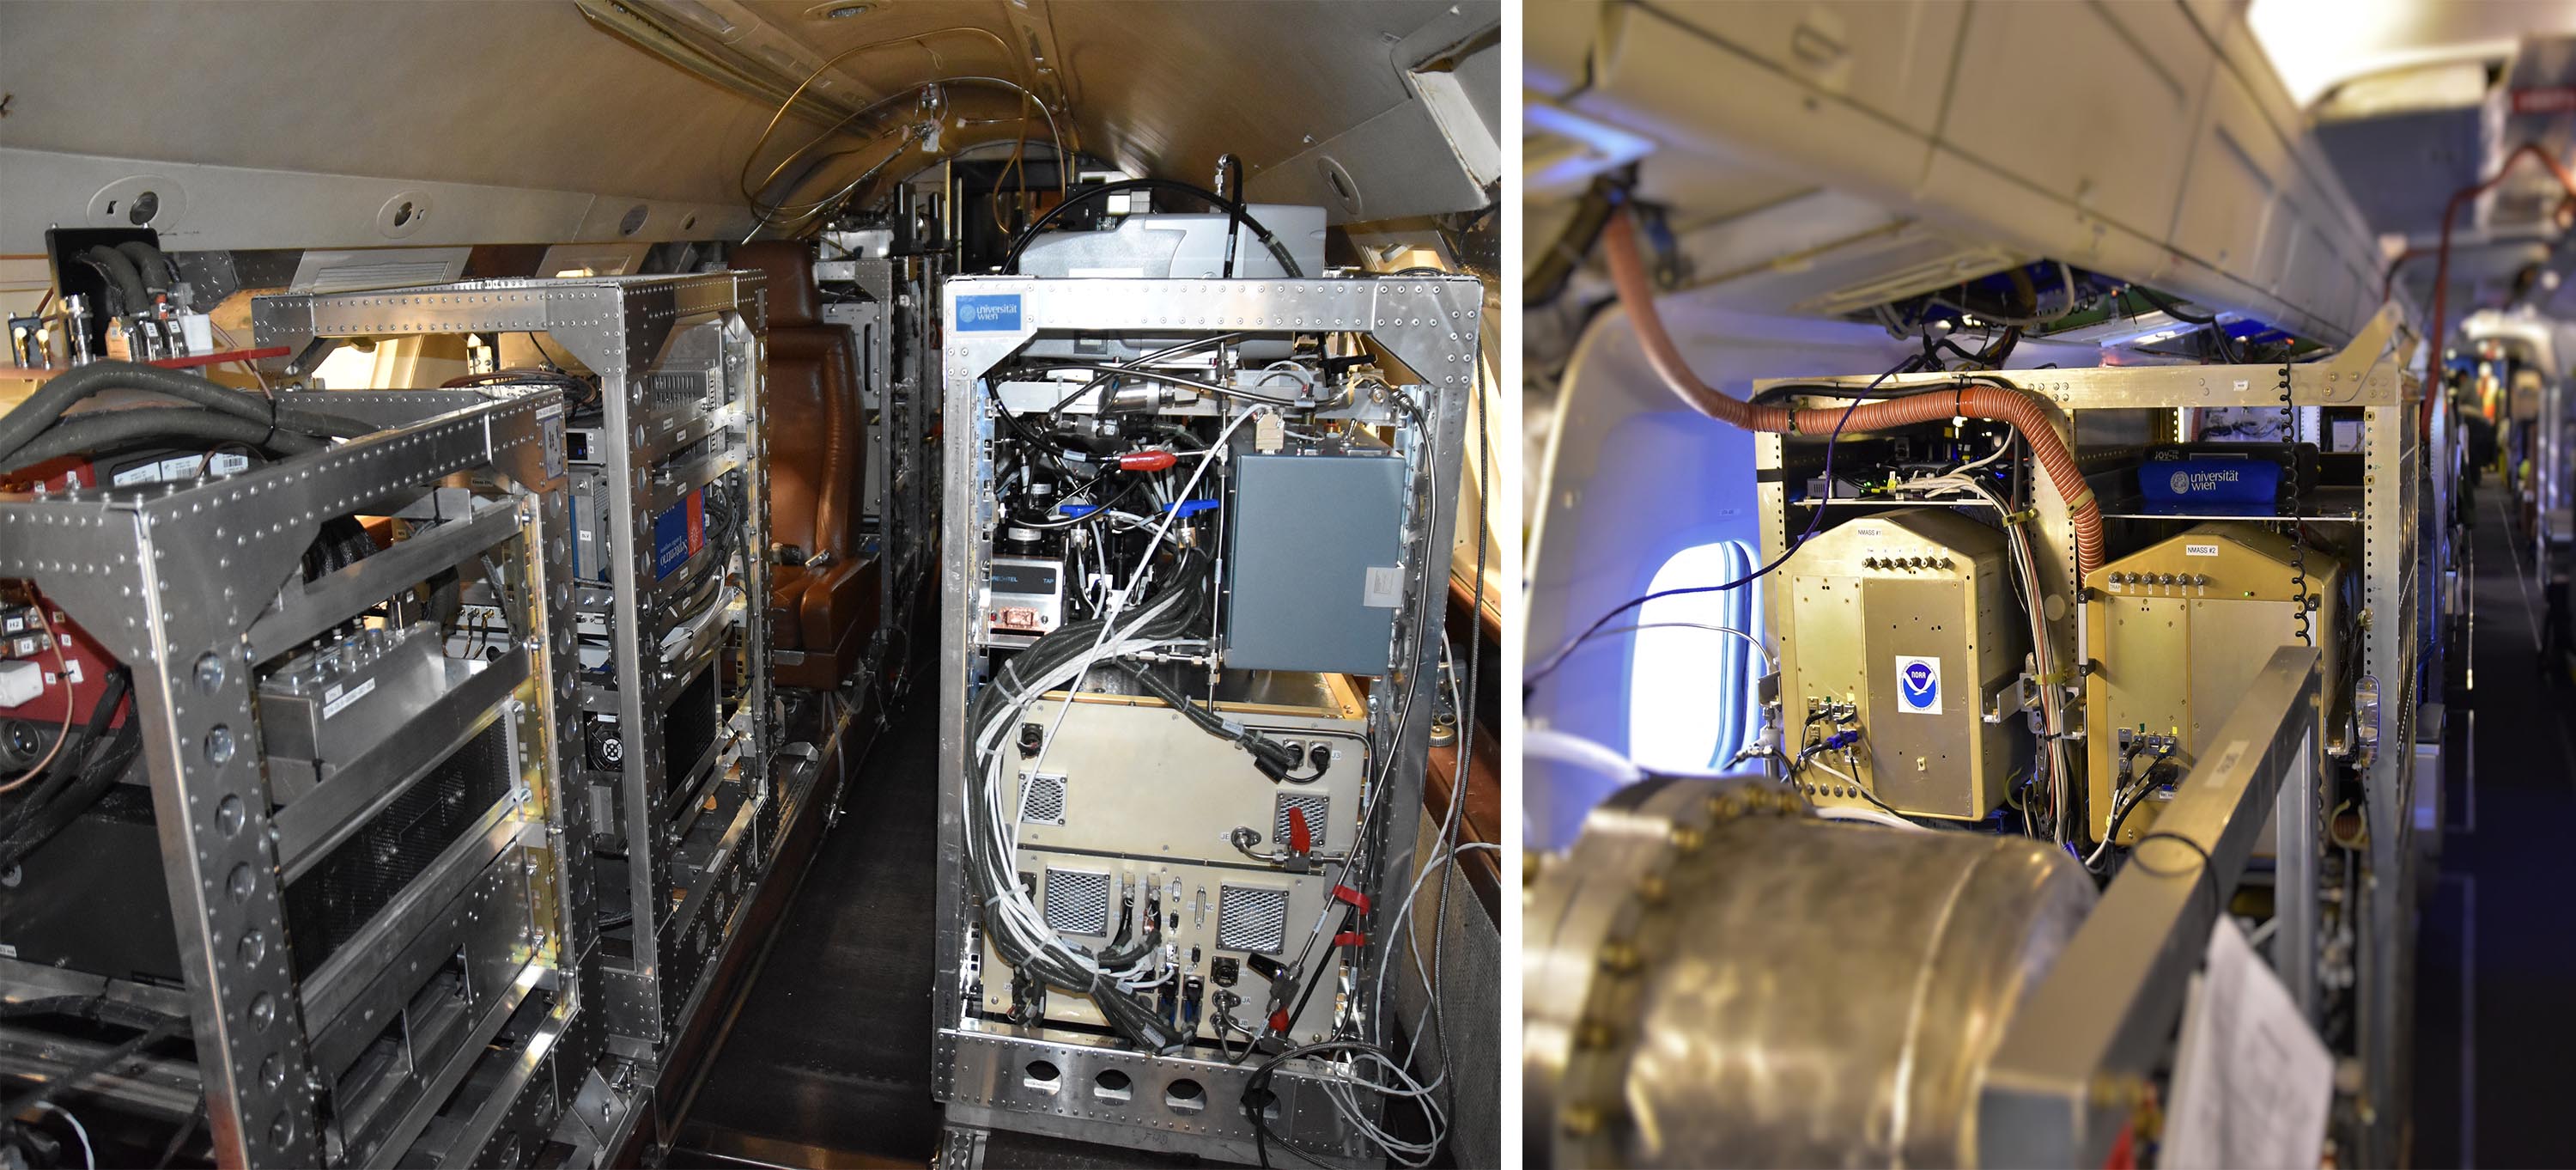
Specialised instruments aboard research planes mean scientists can collect air samples at different altitudes for analysis. Image credit – Bernadett Weinzierl

To sample what is floating around in our skies, project scientists flew the twin-engine Dassault Falcon 20 from the German Aerospace Centre (DLR) in the eastern Mediterranean. During 22 flights, the aircraft took in air to analyse the particles swirling above and around Cyprus in 2017. 

The eastern Mediterranean is an ideal location, because it contains soot from biomass burning, dust from the Sahara Desert and from the Arabian Desert and sulphates and black carbon from traffic and industrial fumes. The aircraft flew as low as 300 metres and as high as 12 km. It also used lasers to track particles in the air.   

Prof. Weinzierl observed that when lots of dust was present, even local weather forecasts tended to be less accurate. Similarly, such particles can fog predictions about climate.  

The Austrian professor also took part in an experiment with a NASA research aircraft that flew from the North Pole down to the middle of the Pacific Ocean, to the outer rim of Antarctica and back up the Atlantic Ocean. This mission allowed her to compare particle cocktails in pristine skies from away from human influence, with those in the highly polluted skies over the eastern Mediterranean.    

Prof. Weinzierl found more large particles, such as mineral dust, high in the atmosphere than had been predicted. Even iregions in the northern hemisphere, very far away from sources10 to 20 micron particles were regularly found in the air, says Prof. Weinzierl. Human hair measures 100 microns across, for comparison, while black carbon consists of particles less than one micron across. 

On the other hand, there was less black carbon present than the professor expected high in the atmosphereWe find that models have more black carbon in the upper troposphere than we find in nature, she said. There is less warming then, than the models would predict, from black carbon.  

One explanation could be that more black carbon is being washed out of the atmosphere by rain than the models predict.  

Black carbon and other pollution seeds clouds. We’re just starting to understand the climate implications
Prof. Weinzierl joined a NASA research aircraft flight from the North Pole to Antarctica and back to compare air particle cocktails in different parts of the world. Image credit – Bernadett Weinzierl

Clouds 

Aerosol particles are critical for cloud formation, and different types affect how the clouds will behave. 

Every single cloud droplet normally forms on an aerosol particle, because clouds cannot form from pure water under atmospheric conditions, said Philip Stier, professor of atmospheric physics at the University of Oxford, in the UK. Cloud droplets can start around molecules emitted by plants, sulphurous compounds spewed from volcanoes or soot from vehicle tailpipes, and more.    

But the science of aerosols and cloud formation is perplexing – and aerosol characteristics are important. ‘You need to know about their size, about their composition and how they are mixing together, said Prof. Stier. For example, floating sea salt quickly absorbs moisture, whereas pure black carbon tends to repel water.  

Clouds themselves will then differ according to how they were seeded. A cloud in a polluted area will generally start from more aerosols and so form more droplets, said Prof. Stier. At the end a cloud formed around tiny man-made particles will usually have more abundant water, smaller droplets.  

Clouds built around salt or desert dust generally contain fewer droplets, but each droplet – like the particles they form around – is larger. If the air is very clean, then often cloud droplets start much bigger, and these clouds can rain out very easily, added Prof. Stier. ‘But the real question is how aerosols affect precipitation on larger scales.’  

Clouds with pollutant aerosols contain more water droplets and appear brighter. This reflects light, cooling the atmosphere. It could be also that such clouds live longer, said Prof. Stierbut these effects remain uncertain.  

Aerosol particles and clouds introduce uncertainties into climate predictions. Their complexities and difficulties in terms of calculationmean that scientists still struggle to understand clouds at microscopic scales and at large scales. But progress is being made. 

Prof. Stier studied how aerosols influence convective clouds as part of the ACCLAIM project. Convective clouds form when warm air rises and include the fluffy cumulus clouds you might see on a summer day.  They are poorly represented in climate models, says Prof. Stier, but new stationary satellites are helping to better track them.   

Heat 

Prof. Stier is now investigating how aerosol particles in our skies influence rainfall in a project called RECAPHe studies the energy balance of the atmosphere on small scales and across expansive cloud fields. For example, when it rains, latent heat is released into the atmosphere.    

The energy balance of the atmosphere varies. In the tropics, we actually get a local enhancement of precipitation (caused by absorbing aerosols, like black carbon), Prof. Stier explained, but at mid-latitudes, where the rotation of the Earth exerts a stronger effect and it is not so easy to divert energy away, we get a very strong decrease in precipitation.  

Artificial intelligence is being used by Prof Stier to crunch and understand masses of data being collected on the movement and effects of particles on clouds and rainfall.  

Meanwhile, Prof Weinzierl’s group continues to analyse the A-LIFE data. The Austrian group developed new methods, including a smart cloud algorithm for the ATom flights. It looks at the data and then says whether you are inside or outside a cloud, Prof. Weinzierl said, and ‘about the type of cloud. 

Discoveries have piled up. Prof. Weinzierl confirmed that the lifetime of black carbon in the high atmosphere is shorter than had been assumed in climate studies.  

Also, her group contributed to the discovery that a natural sulphur compound is important for starting cloud formation in marine atmosphere. They also helped reveal that newly formed particles high in the atmosphere over the tropics help to seed clouds as they coagulate and descend in the atmosphere.   

Understanding how particles influence clouds – and ultimately climate – has been a huge hurdle for scientists. But it is a hurdle they are overcoming by better measurements of particles and a better understanding of their interactions and impact on clouds and climate. 

The research in this article was funded by the EU’s European Research CouncilIf you liked this article, please consider sharing it on social media.

Published by Horizon 


from ScienceBlog.com https://ift.tt/3lnAZMP
Researchers say they’ve identified gene responsible for cellular aging

Researchers say they've identified gene responsible for cellular aging

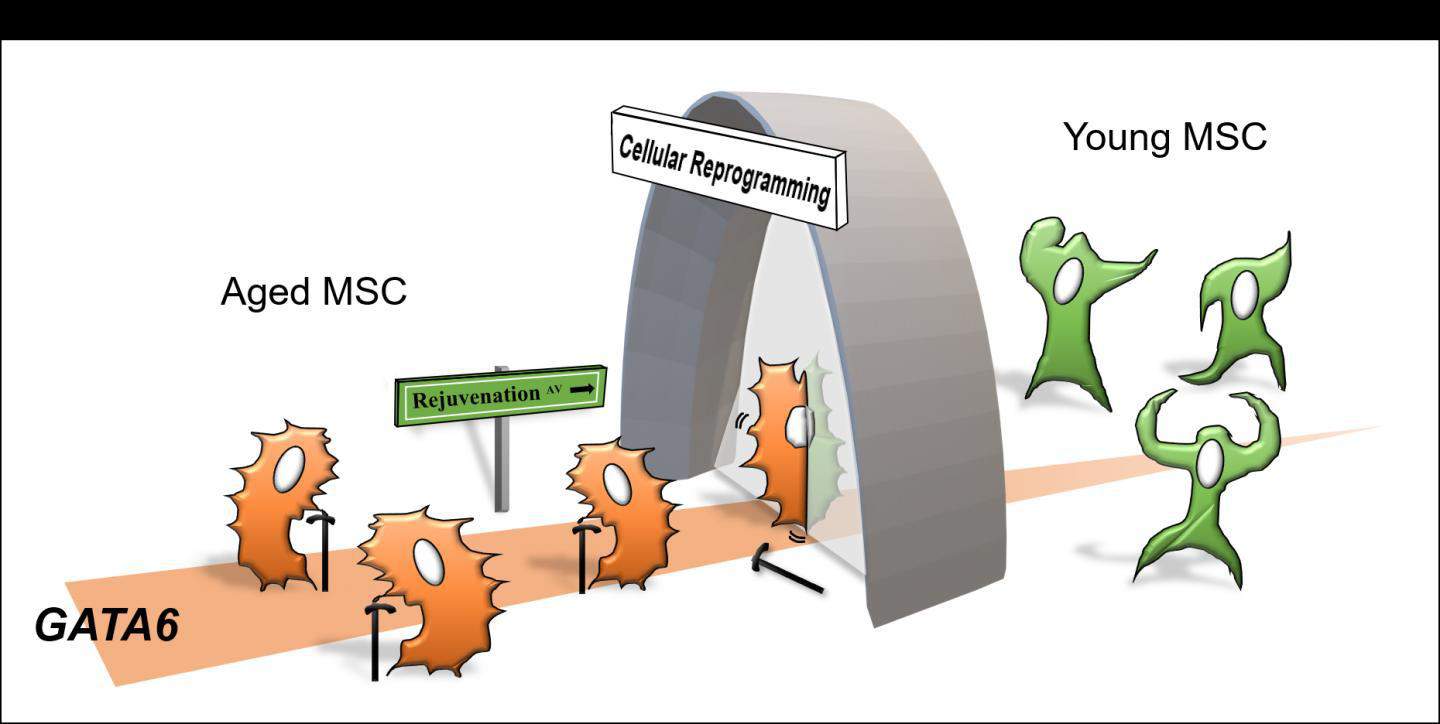
Cellular reprogramming can reverse the aging that leads to a decline in the activities and functions of mesenchymal stem/stromal cells (MSCs). This is something that scientists have known for a while. But what they had not figured out is which molecular mechanisms are responsible for this reversal. A study released today in STEM CELLS appears to have solved this mystery. It not only enhances the knowledge of MSC aging and associated diseases, but also provides insight into developing pharmacological strategies to reduce or reverse the aging process.

The research team, made up of scientists at the University of Wisconsin-Madison, relied on cellular reprogramming – a commonly used approach to reverse cell aging – to establish a genetically identical young and old cell model for this study. “While agreeing with previous findings in MSC rejuvenation by cellular reprogramming, our study goes further to provide insight into how reprogrammed MSCs are regulated molecularly to ameliorate the cellular hallmarks of aging,” explained lead investigator, Wan-Ju Li, Ph.D., a faculty member in the Department of Orthopedics and Rehabilitation and the Department of Biomedical Engineering.

The researchers began by deriving MSCs from human synovial fluid (SF-MSCs) – that is, the fluid found in the knee, elbow and other joints – and reprogramming them into induced pluripotent stem cells (iPSCs). Then they reverted these iPSCs back to MSCs, in effect rejuvenating the MSCs. “When we compared the reprogrammed MSCs to the non-rejuvenated parental MSCs, we found that aging-related activities were greatly reduced in reprogrammed MSCs compared to those in their parental lines. This indicates a reversal of cell aging,” Li said.

The team next conducted an analysis of the cells to determine if there were any changes in global gene expression resulting from the reprogramming. They found that the expression of GATA6, a protein that plays an important role in gut, lung and heart development, was repressed in the reprogrammed cells compared to the control cells. This repression led to an increase in the activity of a protein essential to embryonic development called sonic hedgehog (SHH) as well as the expression level of yet another protein, FOXP1, necessary for proper development of the brain, heart and lung. “Thus, we identified the GATA6/SHH/FOXP1 pathway as a key mechanism that regulates MSC aging and rejuvenation,” Li said.

“Identification of the GATA6/SHH/FOXP1 pathway in controlling the aging of MSCs is a very important accomplishment,” said Dr. Jan Nolta, Editor-in-Chief of STEM CELLS. “Premature aging can thwart the ability to expand these promising cells while maintaining function for clinical use, and enhanced knowledge about the pathways that control differentiation and senescence is highly valuable.”

To determine which of the Yamanaka transcription factors (four reprogramming genes used to derive iPSCs) were involved in repressing GATA6 in the iPSCs, the team analyzed GATA6 expression in response to the knockdown of each factor. This yielded the information that only OCT4 and KLF4 are able to regulate GATA6 activity, a finding consistent with that of several previous studies.

“Overall, we were able to demonstrate that SF-MSCs undergo substantial changes in properties and functions as a result of cellular reprogramming. These changes in iPSC-MSCs collectively indicate amelioration of cell aging. Most significantly, we were able to identify the GATA6/SHH/FOXP1 signaling pathway as an underlying mechanism that controls cell aging-related activities,” Li said.

“We believe our findings will help improve the understanding of MSC aging and its significance in regenerative medicine,” he concluded.

The full article, “GATA6 regulates aging of human mesenchymal stem/stromal cells,” can be accessed at https://stemcellsjournals.onlinelibrary.wiley.com/doi/abs/10.1002/stem.3297.


from ScienceBlog.com https://ift.tt/2Ju04s6

Most popular American movies depict an unhealthy diet

Most popular American movies depict an unhealthy diet

It’s no surprise that most people in the U.S. don’t follow a healthy diet. But Stanford psychologists wanted to go deeper to find out why people don’t eat healthier even when they know it’s better for them. So they looked at an influential force in American popular culture – movies – to see how they depict foods and beverages on-screen to the public.

Video by Kurt Hickman

Stanford researchers examined the 250 top-grossing American movies of recent decades and found the on-screen foods and beverages largely failed U.S. government nutrition recommendations and U.K. youth advertising standards.

It turns out: not very well.

In a new study, the Stanford researchers looked at the 250 top-grossing Hollywood movies between 1994 and 2018 – including “Black Panther,” “Avatar” and “Titanic” – to quantify the foods and beverages shown on-screen and see how well they align with what the government recommends people eat and what Americans are actually eating.

“Movies portray the types of foods and beverages that are normative, valued and reflective of our culture, so the foods and beverages that the film industry decides to depict matter,” said study lead author Bradley Turnwald, a postdoctoral researcher in Stanford’s School of Humanities and Sciences. “Audiences look up to famous celebrities, superheroes and role models, and we’re watching what they’re eating and drinking on screen.”

The study, published in the Nov. 23 issue of the journal JAMA Internal Medicine, discovered on-screen diets failed federal recommendations for saturated fat, fiber and sodium, and depicted frequent instances of high sugar content and alcoholic beverages. Snacks and sweets, including baked goods, candies and processed salty snacks, were the types of foods that showed up on screen most frequently. About 40 percent of beverages in these movies were alcoholic. Even among the G-rated movies – the Motion Picture Association of America’s (MPAA) lowest classification for general audiences with no age restrictions – 20 percent of beverages were alcoholic. A majority of the 250 films analyzed – 88 percent – were accessible to youth with MPAA ratings of G, PG or PG-13.

“The movie-depicted diet largely failed across the board for U.S. government recommended daily intake levels – and it was similar in a lot of ways to what Americans actually eat, which we know to be a mostly unhealthy diet,” said Turnwald. “Movies show unhealthy foods as being stereotypical, which Americans then see, which reinforces what is normative. You get this cycle that just spins round and round.”

A clear message

To determine just how unhealthy the on-screen foods actually are, the researchers looked to other countries like the United Kingdom that are beginning to restrict the types of food and beverages advertised to youth. Advertising unhealthy foods and beverages is restricted in the U.K. if 25 percent or more of an audience includes youth under age 16. The Stanford researchers applied the U.K. rating system to the set of American movies and found that over 70 percent of movies received food ratings that would be illegal to advertise to youth under the U.K. standard. For beverages, over 90 percent of movies received ratings that would fail U.K. advertising standards.

“What we commonly eat and drink and seem to enjoy shapes what movie production studios decide to depict. At the same time movies shape our preferences, our behaviors and our imaginations,” said Hazel Rose Markus, psychology professor and a senior author on the study. “Restricting which foods and beverages are depicted in cultural media, and thus regulating artistic expression, would be an unpopular and un-American solution. Yet given the demonstrated recent culture-shifting power of movies in so many domains – think gender, race, sexual orientation – there is reason for optimism that movies could come to play a major role portraying that Americans eat more than just cake, candy and chips, and in the process, promote healthier food and beverage consumption.”

While this study didn’t measure how viewers actually respond to seeing these foods on-screen, the researchers note that prior research has found that when people are exposed to violence, racial bias, binge-drinking and smoking in movies, it can actually increase their engagement in these problematic behaviors.

“We have poured countless resources into educating people about the importance of eating well and providing more access to healthy foods. But these methods only take us so far,” said Alia Crum, assistant professor of psychology and senior author on the study. “The foods depicted in popular movies send a clear message – not only about what is common to eat but also about what foods are appealing or cool to eat. If our favorite actors and superheroes aren’t eating salads, why should we?”

Interestingly, despite the rising trend of explicit advertising and product placement in movies, the researchers found that only about 11.5 percent of the foods depicted in the movies they analyzed were branded.

“A lot of research has shown that branded product placements for unhealthy snacks and sugary drinks are common in media. However, we were surprised to see that when it comes to movies, 88.5 percent of observations were not branded,” Turnwald said. “This shows that it’s not just branded candy bars and sodas that drove down nutrition scores in movies. Depiction of nutrient-poor foods in popular media extends far beyond branded product placements.”

An opportunity

In the analysis, water showed up onscreen only slightly more than sweetened beverages. And fruits were the second-most common food depicted in movies. Turnwald believes it’s because fruits were often used as a scene prop in a dining room, office or grocery store setting, but says the team is working on a follow-up study to see which on-screen foods are actually eaten in the films.

The researchers say their study is a first step toward being able to quantify what our popular culture considers normative now and lays the groundwork for future studies to track how that changes in the coming years and decades. “Just like no diet is totally undermined or defined by any one food or one food decision, it’s really about our behaviors and our patterns over time,” Turnwald said. “In this study, we found no evidence that movie nutrition scores were improving over the past 25 years, but there is an opportunity moving forward for the film industry to depict healthier diets in the coming years.”

Turnwald notes that in Marvel’s Iron Man trilogy, for example, as Tony Stark’s character evolves, so too does his diet, from cheeseburgers and heavy drinking in Iron Man 1 to fruits, green smoothies and raw vegetable plates in later releases.

“The point is not to say that kids shouldn’t ever be allowed to view people eating a cheeseburger – that’s not realistic,” said Crum. “Putting the question of regulation aside, I think there is a great opportunity here for movie producers and actors to be empowered by these findings – to be more mindful of and take responsibility for the foods they portray on their screens for millions of people to see.”


from ScienceBlog.com https://ift.tt/2KTGPsU

Ultrafast way to manufacture perovskite solar modules

Ultrafast way to manufacture perovskite solar modules

Most solar cells today are made with refined silicon that turns sunlight into clean electricity. Unfortunately, the process of refining silicon is far from clean, requiring vast amounts of energy from carbon-emitting power plants.

For a greener alternative to silicon, researchers have focused on thin-film perovskites – low-cost, flexible solar cells that can be produced with minimal energy and virtually no COemissions.

While perovskite solar cells are promising, significant challenges need to be addressed before they can become commonplace, not least of which is their inherent instability, which makes manufacturing them at scale difficult.

“Perovskite solar technology is at a crossroads between commercialization and flimflammery,” said Stanford University postdoctoral scholar Nick Rolston. “Millions of dollars are being poured into startups. But I strongly believe that in the next three years, if there isn’t a breakthrough that extends cell lifetimes, that money will start to dry up.”

That’s why a new perovskite manufacturing process developed at Stanford is so exciting, Rolston said. In a new study, published in the Nov. 25 issue of the journal Joulehe and his colleagues demonstrate an ultrafast way to produce stable perovskite cells and assemble them into solar modules that could power devices, buildings and even the electricity grid.

“This work provides a new milestone for perovskite manufacturing,” said study senior author Reinhold Dauskardt, the Ruth G. and William K. Bowes Professor in the Stanford School of Engineering. “It resolves some of the most formidable barriers to module-scale manufacturing that the community has been dealing with for years.”

Fingernail-size samples

Perovskite solar cells are thin films of synthetic crystalline made from cheap, abundant chemicals like iodine, carbon and lead.

Thin-film cells are lightweight, bendable and can be grown in open-air laboratories at temperatures near the boiling point of water, a far cry from the 3,000-degree Fahrenheit (1,650-degree Celsius) furnaces needed to refine industrial silicon.

Scientists have developed perovskite cells that convert 25 percent of sunlight to electricity, a conversion efficiency comparable to silicon. But these experimental cells are unlikely to be installed on rooftops anytime soon.

“Most work done on perovskites involves really tiny areas of active, usable solar cell. They’re typically a fraction of the size of your pinky fingernail,” said Rolston, who co-lead the study with William Scheideler, a former Stanford postdoctoral scholar now at Dartmouth College.

Attempts to make bigger cells have produced defects and pinholes that significantly decrease cell efficiency. And unlike rigid silicon cells, which last 20 to 30 years, thin-film perovskite eventually degrades when exposed to heat and moisture.

“You can make a small demonstration device in the lab,” Dauskardt said. “But conventional perovskite processing isn’t scalable for fast, efficient manufacturing.”

Record-setting processor

To address the challenge of large-scale production, the Dauskardt team deployed a patented technology they recently invented called rapid-spray plasma processing.

Nick Rolston & Mark Shwartz

Stanford scientists demonstrate a robotic device that manufactures perovskite solar cells at a rate of 40 feet per minute. The record-fast processor uses two nozzles to make thin films of photovoltaic perovskite. One nozzle spray-coats a chemical solution onto a pane of glass, while the other releases a burst of highly reactive ionized gas or plasma. The patented device was invented by Prof. Reinhold Dauskardt and his Stanford Engineering colleagues.

This technology uses a robotic device with two nozzles to quickly produce thin films of perovskite. One nozzle spray-coats a liquid solution of perovskite chemical precursors onto a pane of glass, while the other releases a burst of highly reactive ionized gas known as plasma.

“Conventional processing requires you to bake the perovskite solution for about half an hour,” Rolston said. “Our innovation is to use a plasma high-energy source to rapidly convert liquid perovskite into a thin-film solar cell in a single step.”

Using rapid-spray processing, the Stanford team was able to produce 40 feet (12 meters) of perovskite film per minute – about four times faster than it takes to manufacture a silicon cell.

“We achieved the highest throughput of any solar technology,” Rolston said. “You can imagine large panels of glass placed on rollers and continuously producing layers of perovskite at speeds never accomplished before.”

In addition to a record production rate, the newly minted perovskite cells achieved a power conversion efficiency of 18 percent.

“We want to make this process as applicable and broadly useful as possible,” Rolston said. “A plasma treatment system might sound fancy, but it’s something you can buy commercially for a very reasonable cost.”

The Stanford team estimated that their perovskite modules can be manufactured for about 25 cents per square foot – far less than the $2.50 or so per square foot needed to produce a typical silicon module.

Solar modules

Silicon solar cells are typically connected together in encapsulated modules to boost their power output and withstand harsh weather conditions. Perovskite manufacturers will eventually have to build stable, efficient modules to be commercially viable.

Ultrafast way to manufacture perovskite solar modules

Nick Rolston, Stanford postdoctoral scholar in materials science and engineering. (Image credit: Courtesy Nick Rolston)

Toward this end, the Stanford team successfully created perovskite modules that continued to operate at 15.5 percent efficiency even after being left on the shelf for five months.

Conventional silicon modules produce electricity at a cost of about 5 cents per kilowatt-hour. To compete with silicon, perovskite modules would have to be encapsulated in a weatherproof layer that keeps out moisture for at least a decade. The research team is now exploring new encapsulation technologies and other ways to significantly improve durability.

“If we can build a perovskite module that lasts 30 years, we could bring down the cost of electricity below 2 cents per kilowatt-hour,” Rolston said. “At that price, we could use perovskites for utility-scale energy production. For example, a 100-megawatt solar farm.”


from ScienceBlog.com https://ift.tt/39sM1OD

Live tracker notes COVID cases, deaths by congressional districts

Live tracker notes COVID cases, deaths by congressional districts

Researchers at the Harvard Center for Population and Development StudiesHarvard Center for Geographic Analysis at the Institute for Quantitative Social Science, and Microsoft AI for Health have created a COVID-19 live tracker that monitors the current status of virus cases and deaths, as well as the reduction of new cases, in U.S. congressional districts.

It is the first compilation of this data, which could be key for elected officials and their constituents to monitor and develop testing strategies, vaccine deployment strategies, and other measures to enable their districts to open safely.

“By connecting previously separate reporting geographies for public health and electoral data, this data set represents an important effort,” said Gary King, director of the Institute for Quantitative Social Science, and Weatherhead University Professor at Harvard.

“As the COVID-19 pandemic continues to spiral out of control in the U.S. (and elsewhere), innovations such as this, which combine both science and public policy, are sorely needed,” said Douglas Richardson, distinguished researcher at Harvard Center for Geographic Analysis.

Nearly a year into the global pandemic, data breakdown by U.S. congressional districts has not been readily available. S.V. Subramanian and researchers in the Geographic Insights Lab, who had previously applied a geographical method to convert county-level opioid prescriptions data to the congressional district level, noticed that similar data was lacking for the pandemic. The team developed COVID-19 metrics for congressional districts and, working with Geographics Analysis center member Wendy Guan, developed a dashboard to share the data. John Kahan, vice president and chief data analytics officer at Microsoft, noted that the team’s work was similar to a project underway at Microsoft, and the groups joined forces to provide mutual scientific support, such as methodologies and data verification.

“The research provides critical insight,” said Nydia M. Velázquez, Congresswoman of New York’s 7th Congressional District and chair of the House Small Business Committee. “Because of this information, the House Small Business Committee can better examine the efficacy of federal programs in reaching the areas most impacted by this virus. Data like this is critical to policymakers, as it improves our ability to legislate changes that ensure aid is going to those that need it most.”

The live tracker contains COVID-19 metrics for each congressional district, such as confirmed cases and deaths per 100K/1M people, cumulative cases and deaths, and new cases and deaths. It also provides the progress-to-zero metric to monitor progress on addressing the pandemic.

The tracker gives elected representatives and their constituents precise information about COVID’s spread in their district. In Texas, for example, a graph reflecting infection by county gives the initial impression that west Texas is doing better than east Texas. When broken down by congressional district, however, the northwestern and southwestern parts of the state actually have the greatest number of COVID cases. The two districts with the most cases “are not even geographically close to the counties with the highest number of cases (Harris County and Dallas County),” said Weixing Zhang of the Harvard Center for Population and Development Studies.

“We’ve heard from many Congressional members that they want to have a better understanding of the disease’s spread in their districts, and so do their constituents,” said Kahan. “The data will be key for policymakers to create policies to ensure safer communities, and allow the public to see the progress we are making together.”


from ScienceBlog.com https://ift.tt/2ViYGeU

Reconstructing vertebrates rise from the water to land

Reconstructing vertebrates rise from the water to land

It’s hard to overstate how much of a game-changer it was when vertebrates first rose up from the waters and moved onshore about 390 million years ago. That transition led to the rise of the dinosaurs and all the land animals that exist today.

“Being able to walk around on land essentially set the stage for all biodiversity and established modern terrestrial ecosystems,” said Stephanie Pierce, Thomas D. Cabot Associate Professor of Organismic and Evolutionary Biology and curator of vertebrate paleontology in the Museum of Comparative Zoology. “It represents an incredibly important period of time in evolutionary history.”

Scientists have been trying for more than a century to unravel exactly how this remarkable shift took place, and their understanding of the process is largely based on a few rare, intact fossils with anatomical gaps between them. A new study from Pierce and Blake Dickson, Ph.D. ’20, looks to provide a more thorough view by zeroing in on a single bone: the humerus.

The study, published today in Nature, shows how and when the first groups of land explorers became better walkers than swimmers. The analysis spans the fin-to-limb transition and reconstructs the evolution of terrestrial movement in early tetrapods. These are the four-limbed land vertebrates whose descendants include extinct and living amphibians, reptiles, and mammals.

The researchers focused on the humerus, the long bone in the upper arm that runs down from the shoulder and connects with the lower arm at the elbow, to get around the dilemma of gaps between well-preserved fossils. Functionally, the humerus is invaluable for movement because it hosts key muscles that absorb much of the stress from quadrupedal locomotion. Most importantly, the bone is found in all tetrapods and the fishes they evolved from and is pretty common throughout the fossil record. The bone represents a time capsule of sorts, with which to reconstruct the evolution of locomotion since it can be examined across the fin-to-limb transition, the researchers said.

“We went in with the idea that the humerus should be able to tell us about the functional evolution of locomotion as you go from being a fish that’s just swimming around and as you come onto land and start walking,” Dickson said.

The researchers analyzed 40 3D fossil humeri for the study, including new fossils collected by collaborators at the University of Cambridge as part of the TW:eed Project. The team looked at how the bone changed over time and its effect on how these creatures likely moved.

Reconstructing vertebrates rise from the water to land
A fossil humeri from an aquatic fish (Eusthenopteron), a transitional tetrapod (Acanthostega), and a terrestrial tetrapod (Ophiacodon). Credit: Stephanie Pierce

The analysis covered the transition from aquatic fishes to terrestrial tetrapods. It included an intermediate group of tetrapods with previously unknown locomotor capabilities. The researchers found that the emergence of limbs in this intermediate group coincided with a transition onto land, but that these early tetrapods weren’t very good at moving on it.

To understand this, the team measured the functional trade-offs associated with adapting to different environments. They found that as these creatures moved from water to land, the humerus changed shape, resulting in new combinations of functional traits that proved more advantageous for life on land than in the water.

That made sense to the researchers. “You can’t be good at everything,” Dickson said. “You have to give up something to go from being a fish to being a tetrapod on land.”

The researchers captured the changes on a topographical map showing where these early tetrapods stood in relation to water-based or land-based living. The scientists said these changes were likely driven by environmental pressures as these creatures adapted to terrestrial life.

The paper describes the transitional tetrapods as having an “L-shaped” humerus that provided some functional benefit for moving on land, but not much. These animals had a long way to go to develop the traits necessary to use their limbs on land to move with ease and skill.

As the humerus continued to change shape, tetrapods improved their movement. The “L” shaped humerus transformed into a more robust, elongated, twisted form, leading to new combinations of functional traits. This change allowed for more effective gaits on land and helped trigger biological diversity and expansion into terrestrial ecosystems. It also helped establish complex food chains based on predators, prey, herbivores, and carnivores still seen today.

Analysis took about four years to complete. Quantifying how the humerus changed shape and function took thousands of hours on a supercomputer. The researchers then analyzed how those changes impacted functional performance of the limb during locomotion and the trade-offs associated.

The innovative approach represents a new way of viewing and analyzing the fossil record — an effort Pierce said was well worth it.

“This study demonstrates how much information you can get from such a small part of an animal’s skeleton that’s been recorded in the fossil record and how it can help unravel one of the biggest evolutionary transformations that has ever occurred,” Pierce said. “This is really cutting-edge stuff.”

This research was supported with funding from the Harvard Museum of Comparative Zoology, the Robert A. Chapman Fellowship, and the Natural Environment Research Council.


from ScienceBlog.com https://ift.tt/2Jc9sBb

Coated nanoparticles survive immune system and deliver drugs

Coated nanoparticles survive immune system and deliver drugs

Nanoparticles are promising drug delivery tools, offering the ability to administer drugs directly to a specific part of the body and avoid the awful side effects so often seen with chemotherapeutics.

But there’s a problem. Nanoparticles struggle to get past the immune system’s first line of defense: proteins in the blood serum that tag potential invaders. Because of this, only about 1 percent of nanoparticles reach their intended target.

“No one escapes the wrath of the serum proteins,” said Eden Tanner, a former postdoctoral fellow in bioengineering at the Harvard John A. Paulson School of Engineering and Applied Sciences (SEAS).

Now, Tanner and a team of researchers led by Samir Mitragotri, the Hiller Professor of Bioengineering and Hansjorg Wyss Professor of Biologically Inspired Engineering at SEAS, have developed an ionic forcefield that prevents proteins from binding to and tagging nanoparticles.

In mouse experiments, nanoparticles coated with the ionic liquid survived significantly longer in the body than uncoated particles and, surprisingly, 50 percent of the nanoparticles made it to the lungs. It’s the first time that ionic liquids have been used to protect nanoparticles in the blood stream.

“The fact that this coating allows the nanoparticles to slip past serum proteins and hitch a ride on red blood cells is really quite amazing because once you are able to fight the immune system effectively, lots of opportunities open up,” said Mitragotri, who is also a core faculty member of Harvard’s Wyss Institute for Biologically Inspired Engineering.

The research is published in Science Advances.

Coated nanoparticles survive immune system and deliver drugs

Transmission electron microscopy image of the ionic liquid coating the nanoparticle.

Ionic liquids, essentially liquid salts, are highly tunable materials that can hold a charge.

“We knew that serum proteins clear out nanoparticles in the bloodstream by attaching to the surface of the particle and we knew that certain ionic liquids can either stabilize or destabilize proteins,” said Tanner, who is now an assistant professor of chemistry and biochemistry at the University of Mississippi. “The question was, could we leverage the properties of ionic liquids to allow nanoparticles to slip past proteins unseen.”

“The great thing about ionic liquids is that every small change you make to their chemistry results in a big change in their properties,” said Christine Hamadani, a former graduate student at SEAS and first author of the paper. “By changing one carbon bond, you can change whether or not it attracts or repels proteins.”

Hamadani is currently a graduate student at Tanner’s lab at the University of Mississippi.

The researchers coated their nanoparticles with the ionic liquid choline hexenoate, which has an aversion to serum proteins. Once in the body, these ionic-liquid coated nanoparticles appeared to spontaneously attach to the surface of red-blood cells and circulate until they reached the dense capillary system of the lungs, where the particles sheared off into the lung tissue.

“This hitchhiking phenomenon was a really unexpected discovery,” said Mitragotri. “Previous methods of hitchhiking required special treatment for the nanoparticles to attach to red blood cells and even then, they only stayed at a target location for about six hours. Here, we showed 50 percent of the injected dose still in the lungs after 24 hours.”

The research team still needs to understand the exact mechanism that explains why these particles travel so well to lung tissue, but the research demonstrates just how precise the system can be.

“This is such a modular technology,” said Tanner, who plans to continue the research in her lab at University of Mississippi. “Any nanoparticle with a surface change can be coated with ionic liquids and there are millions of ionic liquids that can be tuned to have different properties. You could tune the nanoparticle and the liquid to target specific locations in the body.”

“We as a field need as many tools as we can to fight the immune system and get drugs where they need to go,” said Mitragotri. “Ionic liquids are the latest tool on that front.”

The research was co-authored by Morgan J. Goetz.


from ScienceBlog.com https://ift.tt/36jVuFS

When ice sheets melt, it’s a seesaw effect

When ice sheets melt, it’s a seesaw effect

To see how deeply interconnected the planet truly is, look no further than the massive ice sheets on the Northern Hemisphere and South Pole.

Thousands of miles apart, they are hardly next-door neighbors, but according to new research from a team of international scientists — led by Natalya Gomez, Ph.D. ’14, and including Harvard Professor Jerry X. Mitrovica — what happens in one region has a surprisingly direct and outsized effect on the other, in terms of ice expanding or melting.

The analysis, published in Nature, shows for the first time that changes in the Antarctic ice sheet were caused by the melting of ice sheets in the Northern Hemisphere. The influence was driven by sea-level changes caused by the melting ice in the north during the past 40,000 years. Understanding how this works can help climate scientists grasp future changes as global warming increases the melting of major ice sheets and ice caps, researchers said.

The study models how this seesaw effect works. Scientists found that when ice on the Northern Hemisphere stayed frozen during the last peak of the Ice Age, about 20,000 to 26,000 years ago, it led to reduced sea levels in Antarctica and growth of the ice sheet there. When the climate warmed after that peak, the ice sheets in the north started melting, causing sea levels in the southern hemisphere to rise. This rising ocean triggered the ice in Antarctica to retreat to about the size it is today over thousands of years, a relatively quick response in geologic time.

The question of what caused the Antarctic ice sheet to melt so rapidly during this warming period had been a longstanding enigma.

“That’s the really exciting part of this,” said Mitrovica, the Frank B. Baird Jr. Professor of Science in the Department of Earth and Planetary Sciences. “What was driving these dramatic events in which the Antarctic released huge amounts of ice mass? This research shows that the events weren’t ultimately driven by anything local. They were driven by sea level rising locally but in response to the melting of ice sheets very far away. The study establishes an underappreciated connection between the stability of the Antarctic ice sheet and significant periods of melting in the Northern Hemisphere.”

The retreat was consistent with the pattern of sea level change predicted by Gomez, now an assistant professor of earth and planetary sciences at McGill University, and colleagues in earlier work on the Antarctic continent. The next step is expanding the study to see where else ice retreat in one location drives retreat in another. That can provide insight on ice sheet stability at other times in the history, and perhaps in the future.

“Looking to the past can really help us to understand how ice sheets and sea levels work,” Gomez said. “It gives us a better appreciation of how the whole Earth system works.”

Along with Gomez and Mitrovica, the team of scientists on the project included researchers from Oregon State University and the University of Bonn in Germany. The rocks they focused on, called ice-rafted debris, were once embedded inside the Antarctic ice sheet. Fallen icebergs carried them into the Southern Ocean. Researchers determined when and where they were released from the ice sheet. They combined ice-sheet and sea-level modeling with sediment core samples from the ocean bottom near Antarctica to verify their findings. And researchers also looked at markers of past shorelines to see how the ice sheet’s edge has retreated.

When ice sheets melt, it’s a seesaw effect

This was taken in the Scotia Sea during the coring campaign in 2007.

Photo by Michael Weber

Gomez has been researching ice sheets since she was a Graduate School of Arts and Sciences student in the Mitrovica Group. She led a study in 2010 that showed that gravitational effects of ice sheets are so strong that when ice sheets melt, the expected sea level rise from all that meltwater entering the oceans would be counterbalanced in nearby areas. Gomez showed that if all of the ice in the west Antarctic ice sheet melted, it could actually lower sea level near the ice by as much as 300 feet, but the sea level would rise significantly more than expected in the Northern Hemisphere.

This paper furthered that study by asking how melting ice sheets in one part of the climate system affected another. In this case, the researchers looked at the ice sheets in the Northern Hemisphere that once covered North America and Northern Europe.

By putting together modeling data on sea-level rise and ice-sheet melting with the debris left over from icebergs that broke off Antarctica during the Ice Age, the researchers simulated how sea levels and ice dynamics changed in both hemispheres over the past 40,000 years.

The researchers were able to explain several periods of instability during the past 20,000 years when the Antarctic ice sheet went through phases of rapid melting known as “meltwater pulses.” In fact, according to their model, if not for these periods of rapid retreat, the Antarctic ice sheet, which covers almost 14 million square kilometers and weighs about 26 million gigatons, would be even more of a behemoth than it is now.

With the geological records, which were collected primarily by Michael Webster from the University of Bonn, the researchers confirmed the timeline predicted by their model and saw that this sea-level change in Antarctica and the mass shedding corresponded with episodes of melting of ice sheets in the Northern Hemisphere.

The data caught Gomez by surprise. More than anything, though, it deepened her curiosity about these frozen systems.

“These ice sheets are really dynamic, exciting, and intriguing parts of the Earth’s climate system. It’s staggering to think of ice that is several kilometers thick, that covers an entire continent, and that is evolving on all of these different timescales with global consequences,” Gomez said. “It’s just motivation for trying to better understand these really massive systems that are so far away from us.”

This work was partially supported by the Natural Sciences and Engineering Research Council, the Canada Research Chair, the Canadian Foundation for Innovation, the Deutsche Forschungsgemeinschaft, and NASA.


from ScienceBlog.com https://ift.tt/33rUHkk

Scientists develop new gene therapy for eye disease

Scientists develop new gene therapy for eye disease

Scientists from Trinity have developed a new gene therapy approach that offers promise for one day treating an eye disease that leads to a progressive loss of vision and affects thousands of people across the globe.

The study, which involved a collaboration with clinical teams in the Royal Victoria Eye and Ear Hospital and the Mater Hospital, also has implications for a much wider suite of neurological disorders associated with ageing.

The scientists publish their results today in leading journal, Frontiers in Neuroscience.

Characterised by degeneration of the optic nerves, DOA typically starts to cause symptoms in patients in their early adult years. These include moderate vision loss and some colour vision defects, but severity varies, symptoms can worsen over time and some people may become blind. There is currently no way to prevent or cure DOA.

A gene (OPA1) provides instructions for making a protein that is found in cells and tissues throughout the body, and which is pivotal for maintaining proper function in mitochondria, which are the energy producers in cells.

Without the protein made by OPA1, mitochondrial function is sub-optimal and the mitochondrial network which in healthy cells is well interconnected is highly disrupted.

For those living with DOA, it is mutations in OPA1 and the dysfunctional mitochondria that are responsible for the onset and progression of the disorder.

The new gene therapy

The scientists, led by Dr Daniel Maloney and Professor Jane Farrar from Trinity’s School of Genetics and Microbiology, have developed a new gene therapy, which successfully protected the visual function of mice who were treated with a chemical targeting the mitochondria and were consequently living with dysfunctional mitochondria.

The scientists also found that their gene therapy improved mitochondrial performance in human cells that contained mutations in the OPA1 gene, offering hope that it may be effective in people.

Dr Maloney, Research Fellow, said:

We used a clever lab technique that allows scientists to provide a specific gene to cells that need it using specially engineered non-harmful viruses. This allowed us to directly alter the functioning of the mitochondria in the cells we treated, boosting their ability to produce energy which in turn helps protects them from cell damage.

“Excitingly, our results demonstrate that this OPA1-based gene therapy can potentially provide benefit for diseases like DOA, which are due to OPA1 mutations, and also possibly for a wider array of diseases involving mitochondrial dysfunction.”

Importantly, mitochondrial dysfunction causes problems in a suite of other neurological disorders such as Alzheimer’s and Parkinson’s disease. The impacts gradually build up over time, which is why many may associate such disorders with ageing.

Professor Farrar, Research Professor, added:

“We are very excited by the prospect of this new gene therapy strategy, although it is important to highlight that there is still a long journey to complete from a research and development perspective before this therapeutic approach may one day be available as a treatment.

“OPA1 mutations are involved in DOA and so this OPA1-based therapeutic approach is relevant to DOA. However mitochondrial dysfunction is implicated in many neurological disorders that collectively affect millions of people worldwide. We think there is great potential for this type of therapeutic strategy targeting mitochondrial dysfunction to provide benefit and thereby make a major societal impact. Having worked together with patients over many years who live with visual and neurological disorders it would be a privilege to play a role in a treatment that may one day help many.”  

The research was supported by Science Foundation Ireland, the Health Research Board of Ireland, Fighting Blindness Ireland, and the Health Research Charities Ireland. A copy of the journal article is available on request.


from ScienceBlog.com https://ift.tt/36gazZ9

California GHG in the plus column. Emissions-reduction steps state can take to get back on track

California GHG in the plus column. Emissions-reduction steps state can take to get back on track

California has been a leader when it comes to climate-change-correction work, meaning efforts by the state to reduce annual greenhouse gas (GHG) emissions output have been working. But the most recent numbers tell a slightly different tale. This is reflected in the latest (2018) California GHG emissions inventory.

Compared to annual Golden State GHG output the year prior (2017) which, by the way, was 424.5 million metric tons of carbon dioxide equivalent (MMTCO2e) emissions, 2018’s output was a slightly higher 425.3 MMTCO2e, a 0.8 MMTCO2e gain.1 As a gain, be it small, modest or substantial, state GHG emissions output is headed in the wrong direction.

Listed below are the categories with their corresponding numbers2 (in MMTCO2e) 2018 versus 2017:

  • Agriculture: 32.57 (2018); 32.32 (2017)
  • Commercial and Residential: 41.37 (2018); 41.27 (2017)
  • Electric Power: 63.11 (2018); 62.13 (2017)
  • High Global Warming Potential (gases): 20.46 (2018); 19.99 (2017)
  • Industrial: 89.18 (2018); 88.73 (2017)
  • Recycling and Waste: 9.09 (2018); 8.99 (2017)

The one bright spot, meanwhile, is transportation whose numbers for 2018 and 2017, respectively, are as follows: 169.50 MMTCO2e and 171.02 MMTCO2e. California transportation was covered much more in depth in “Latest California greenhouse gas emissions inventory a mixed bag. To meet 2030 target state has its work cut out” on the Air Quality Matters blog back on Oct. 21, 2020.

Since the state in terms of annual GHG emissions output had been seeing improvement, what changed in 2018 (the latest year for which data are available) versus 2017 and what will the state need to do in order to get back on (the GHG emission-reduction) track?

As to why the respective GHG increases above, the California Environmental Protection Agency Air Resources Board (ARB) in its California Greenhouse Gas Emissions for 2000 to 2018 inventory, breaks it down.

In Electric Power hydroelectric power fluctuates year to year. In some years there is more reliance on hydropower while in other years there is less. “From 2017 to 2018, electric power emissions increased by 1 MMTCO2e, primarily due to a 39 percent decrease in in-state hydropower generation (a result of lower precipitation levels in the 2017-2018 winter season) that was partially compensated by increases in solar generation and other lower GHG intensity resources,” writes the ARB.

California Mojave Desert-based solar farm

Over in the Industrial sector, output from the thermal arm of cogeneration processes, cement production as well as that from the “other” category all saw GHG increases 2018 over 2017. This alone was enough to cause a rise in GHG of 0.45 MMTCO2e. (p. 14)

Furthermore, in the area of Commercial and Residential Fuel Combustion, in regard to this, the ARB affirms, “Changes in annual fuel combustion emissions are primarily driven by variability in weather conditions, and the need for heating in buildings, as well as population growth. In 2018, emissions increased slightly compared to 2017 due to a rise in commercial natural gas use.” (p. 15)

Agriculture, meanwhile, 2018 versus 2017, saw its emissions climb 0.25 MMTCO2e primarily due to increase in Crop Growing and Harvesting-related GHG and to a far lesser degree to Livestock Enteric Fermentation. Adds the ARB, “The increase from 2017 to 2018 is due to climatic factors that affect the amount of N2O [nitrous oxide] produced from synthetic fertilizer (e.g. precipitation and min/max temperature). (p. 17)

The increase in High Global Warming Potential Gases between 2017 and 2018 is principally due to a rise in Ozone Depleting Substances (ODS) Substitutes which continues the positive trend since at least 2000. As it relates, the ARB notes, “Emissions of ODS substitutes are expected to continue to grow as they replace ODS being phased out under the Montreal Protocol. (pp. 18-19)

Finally, in Recycling and Waste, Landfill Emissions, landfill gas – methane (CH4) mainly, rose between 2017 and 2018. In this, the three contributing factors that had a direct impact are: Landfilled Solid Waste, Degradable Carbon Deposited and Composting Feedstock Processed, the first from 2017 to 2018 edging up 0.09 MMTCO2e while the third saw an increase of 0.01 MMTCO2e.3

Now, as for what steps the state can take to help ensure a course correction related to year to year GHG emissions output is realized, Katelyn Roedner Sutter in her “Western Climate Initiative Auction strengthens as state has opportunity to increase its climate ambition,” Aug. 25, 2020 Climate 411 blog post had this to say:

“While California has been a climate leader amid federal inaction, the state still needs to increase its ambition in fighting climate change. A crucial opportunity to do this is through the upcoming Scoping Plan process, where the state has the chance to increase the stringency of the cap-and-trade program. This is important as California plans for how to reach its 2030 emissions reduction goal of 40% below 1990 emission levels. At the same time, the state should codify a mid-century climate target in order to reach carbon neutrality by 2045 and achieve a 100% clean economy. Just as importantly, California should encourage and support other states and countries to take their own ambitious climate action—which at a minimum needs to include the adoption of binding, declining limits on greenhouse gas pollution consistent with scientific recommendations.”4

Notes

  1. Referenced for this report was the “California Greenhouse Gas Inventory for 2000-2018” data sheet from the California Environmental Protection Agency Air Resources Board. p. 2 https://ww3.arb.ca.gov/cc/inventory/data/tables/ghg_inventory_scopingplan_sum_2000-18.pdf
  2. Ibid, pp. 1-2
  3. Ibid, p. 2
  4. Copyright © 2020 Environmental Defense Fund. Used by permission

Image above: Environmental Defense Fund

Published by Alan Kandel


from ScienceBlog.com https://ift.tt/39nshM8

Featured Post

Prof. Dr. Thomas Braunbeck | University of Heidelberg, Germany | Best Researcher Award

  International Research Awards on New Science Inventions Join us for the International Research Awards on New Science Inventions, a premie...

Popular