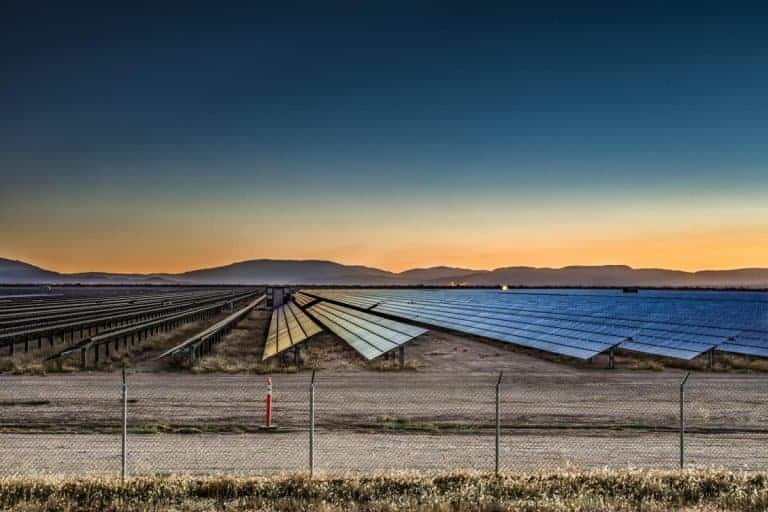
California has been a leader when it comes to climate-change-correction work, meaning efforts by the state to reduce annual greenhouse gas (GHG) emissions output have been working. But the most recent numbers tell a slightly different tale. This is reflected in the latest (2018) California GHG emissions inventory.
Compared to annual Golden State GHG output the year prior (2017) which, by the way, was 424.5 million metric tons of carbon dioxide equivalent (MMTCO2e) emissions, 2018’s output was a slightly higher 425.3 MMTCO2e, a 0.8 MMTCO2e gain.1 As a gain, be it small, modest or substantial, state GHG emissions output is headed in the wrong direction.
Listed below are the categories with their corresponding numbers2 (in MMTCO2e) 2018 versus 2017:
- Agriculture: 32.57 (2018); 32.32 (2017)
- Commercial and Residential: 41.37 (2018); 41.27 (2017)
- Electric Power: 63.11 (2018); 62.13 (2017)
- High Global Warming Potential (gases): 20.46 (2018); 19.99 (2017)
- Industrial: 89.18 (2018); 88.73 (2017)
- Recycling and Waste: 9.09 (2018); 8.99 (2017)
The one bright spot, meanwhile, is transportation whose numbers for 2018 and 2017, respectively, are as follows: 169.50 MMTCO2e and 171.02 MMTCO2e. California transportation was covered much more in depth in “Latest California greenhouse gas emissions inventory a mixed bag. To meet 2030 target state has its work cut out” on the Air Quality Matters blog back on Oct. 21, 2020.
Since the state in terms of annual GHG emissions output had been seeing improvement, what changed in 2018 (the latest year for which data are available) versus 2017 and what will the state need to do in order to get back on (the GHG emission-reduction) track?
As to why the respective GHG increases above, the California Environmental Protection Agency Air Resources Board (ARB) in its California Greenhouse Gas Emissions for 2000 to 2018 inventory, breaks it down.
In Electric Power hydroelectric power fluctuates year to year. In some years there is more reliance on hydropower while in other years there is less. “From 2017 to 2018, electric power emissions increased by 1 MMTCO2e, primarily due to a 39 percent decrease in in-state hydropower generation (a result of lower precipitation levels in the 2017-2018 winter season) that was partially compensated by increases in solar generation and other lower GHG intensity resources,” writes the ARB.
Over in the Industrial sector, output from the thermal arm of cogeneration processes, cement production as well as that from the “other” category all saw GHG increases 2018 over 2017. This alone was enough to cause a rise in GHG of 0.45 MMTCO2e. (p. 14)
Furthermore, in the area of Commercial and Residential Fuel Combustion, in regard to this, the ARB affirms, “Changes in annual fuel combustion emissions are primarily driven by variability in weather conditions, and the need for heating in buildings, as well as population growth. In 2018, emissions increased slightly compared to 2017 due to a rise in commercial natural gas use.” (p. 15)
Agriculture, meanwhile, 2018 versus 2017, saw its emissions climb 0.25 MMTCO2e primarily due to increase in Crop Growing and Harvesting-related GHG and to a far lesser degree to Livestock Enteric Fermentation. Adds the ARB, “The increase from 2017 to 2018 is due to climatic factors that affect the amount of N2O [nitrous oxide] produced from synthetic fertilizer (e.g. precipitation and min/max temperature). (p. 17)
The increase in High Global Warming Potential Gases between 2017 and 2018 is principally due to a rise in Ozone Depleting Substances (ODS) Substitutes which continues the positive trend since at least 2000. As it relates, the ARB notes, “Emissions of ODS substitutes are expected to continue to grow as they replace ODS being phased out under the Montreal Protocol. (pp. 18-19)
Finally, in Recycling and Waste, Landfill Emissions, landfill gas – methane (CH4) mainly, rose between 2017 and 2018. In this, the three contributing factors that had a direct impact are: Landfilled Solid Waste, Degradable Carbon Deposited and Composting Feedstock Processed, the first from 2017 to 2018 edging up 0.09 MMTCO2e while the third saw an increase of 0.01 MMTCO2e.3
Now, as for what steps the state can take to help ensure a course correction related to year to year GHG emissions output is realized, Katelyn Roedner Sutter in her “Western Climate Initiative Auction strengthens as state has opportunity to increase its climate ambition,” Aug. 25, 2020 Climate 411 blog post had this to say:
“While California has been a climate leader amid federal inaction, the state still needs to increase its ambition in fighting climate change. A crucial opportunity to do this is through the upcoming Scoping Plan process, where the state has the chance to increase the stringency of the cap-and-trade program. This is important as California plans for how to reach its 2030 emissions reduction goal of 40% below 1990 emission levels. At the same time, the state should codify a mid-century climate target in order to reach carbon neutrality by 2045 and achieve a 100% clean economy. Just as importantly, California should encourage and support other states and countries to take their own ambitious climate action—which at a minimum needs to include the adoption of binding, declining limits on greenhouse gas pollution consistent with scientific recommendations.”4
Notes
- Referenced for this report was the “California Greenhouse Gas Inventory for 2000-2018” data sheet from the California Environmental Protection Agency Air Resources Board. p. 2 https://ww3.arb.ca.gov/cc/inventory/data/tables/ghg_inventory_scopingplan_sum_2000-18.pdf
- Ibid, pp. 1-2
- Ibid, p. 2
- Copyright © 2020 Environmental Defense Fund. Used by permission
Image above: Environmental Defense Fund
Published by Alan Kandel
from ScienceBlog.com https://ift.tt/39nshM8


No comments:
Post a Comment