Showing posts with label new inventions conference. Show all posts

No Gold Standard: Measuring Success in Medical Affairs

To understand true publication impact and influence patient outcomes, Medical Affairs teams must have their own benchmarks

Compass Points: The Future of Medical Affairs is a series exploring the strategic challenges facing Medical Affairs teams in today’s communication landscape—and the tools that will help them get it right.

The best publication strategy is like a treatment plan: bespoke

In the past, journal citations served as the primary metric for measuring publication impact. Citations all but guaranteed a share of voice and influence amongst key opinion leaders and healthcare practitioners; they were also a simple, clear metric to share upward, proving research impact and justifying the allocation of resources.

Today, journals have come to occupy a different place in the Medical Affairs community. They still confer legitimacy, but they’re not the only way to have an impact; they aren’t even necessarily the most appropriate channel through which teams can or should disseminate information. 

How scientific information travels can be measured in both scientific impact and real world impact. Scientific impact comprises long-tail, more static measures such as citations and subsequent policy changes tracked over the course of months or years. But real-world impact—how a publication influences thought, conversation and even behavior—can be observed in how information ripples through other more immediate channels, like social or broadcast media and forums. 

Capturing an accurate picture of how a publication has performed requires a view of both. This holistic view allows teams to accurately benchmark performance, measure impact, and demonstrate value to stakeholders, supporting the overarching goal of improving patient outcomes.

The role of the journal has changed

While journals still heavily inform the provision of healthcare alongside clinical guidelines and regulatory bodies, they are not the only place members of the life sciences community can encounter and learn about new research.

As scientific information has come to travel on more horizontal, peer-to-peer channels, such as social media or podcasts hosted by trusted key opinion leaders, practitioners are able to learn about and interact with new research outside of the journal publication and conference cycle. This makes it easier for HCPs to stay on top of relevant research, and to quickly sift through the studies that are relevant to their clinical practice. This is why, depending on the therapeutic area and the goals of a given publication launch, Medical Affairs teams may find they gain more traction by diversifying to non-traditional channels. 

But in order for publication planners to take advantage of this reality—to optimize distribution across geographies, channels and a variety of timescales—requires dynamic, granular data that is consistently tracked through time. And as journals have come to form only part of the life sciences research diet, Medical Affairs teams have been left without a single, strategic reference point both for forward-planning and post-publication performance reporting. 

As a result, teams find themselves in a familiar position: unable to reliably demonstrate impact, defend decisions to stakeholders, or to quickly iterate for later distribution plans. This can undermine a team’s efficacy, and ultimately delay or limit influence on patient outcomes. 

What teams lose without a consistent benchmark

Benchmarking plays a critical role in publication planning. It allows teams to reference both the performance of earlier publications and the work of competitors, and to learn, in real time, what is working and what is not. Without benchmarks, it is impossible to know what is reasonable for research to achieve, and therefore, impossible to contextualize impact and prove a return on education. 

But benchmarking is also one of the most laborious parts of the publication planning cycle. The process of consistently benchmarking, tracking, reconciling and cleaning point-in-time data—from social media, journals, podcasts, conferences, magazine articles, and more—can take teams weeks of work. And because of the fragmentation inherent to the process, all of this work, ultimately, still may not be able to capture the nuance of a publication’s impact.

The knock-on effect is that teams are unable to design strategies which are optimized for a given therapeutic area and to meet specific performance goals, such as social media engagement. This undermines the team’s ability to demonstrate that strategic objectives are met and can limit the diffusion of information into communities that could benefit from it. 

This cycle repeats; without live, ongoing benchmarking, it’s impossible to see what’s changing in the competitive landscape and react to it. 

In recent years, the Medical Affairs community has matured dramatically with regards to its use of data. Teams rely heavily on analytics and data-driven decision-making. They know what data is available to them and how they can use it to inform publication strategies. 

But the tools available for assembling and parsing this data haven’t kept pace. Even as many teams embrace the use of general-purpose AI, the output is often unstandardized and non-reproducible—what AI surfaces today may be different from what it surfaces tomorrow, so teams can’t be sure they’re comparing like with like. In other words, teams gain speed, but not certainty.

This is what Compass by Dimensions was created to address. It brings together both traditional and alternative metrics so teams can easily benchmark against internal and competitor data, track publication performance through time and across channels in a standard and simple way, allowing to better demonstrate value, influence therapeutic behavior, meet education objectives, and trace real-world research impact. As a result, teams can move from publication strategies which are fundamentally reactive to those which are proactive, and as a result, better able to meet strategic objectives.

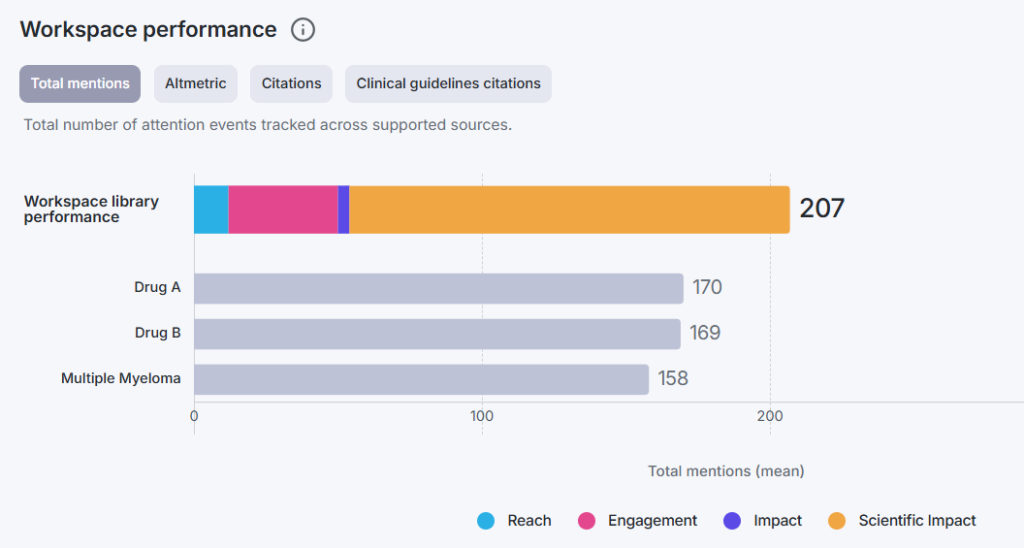
Figure 1: Workspace performance. Total number of attention events tracked across supported sources.

Tapping into the discussions that matter

Improving patient outcomes is the result of a confluence of events: research must be carried out, written up, disseminated, and then found by the relevant policy makers or healthcare practitioners to stand a chance of driving real-world impact. That means Medical Affairs teams need to look at both formal and peer-to-peer channels to measure influence. 

Compass is driven by data sources from two leading services in the scientific and research community, Dimensions and Altmetric. 

Dimensions hosts one of the largest collections of interconnected global research data, re-imagining research discovery with access to grants, publications, clinical trials, patents and policy documents all in one place. This data source provides a robust view of traditional channels.

Altmetric is a leading provider of alternative research metrics, helping everyone involved in research gauge the impact of their work. Altmetric searches thousands of online sources including social media, revealing where research is being shared and discussed—and the sentiment of that discussion. This is where real-world impact manifests first. 

In bringing these two data sources together, Compass allows teams to track the whole publication attention lifecycle, from social media posts minutes and hours after publication, all the way to citations and guideline mentions years after it was published, all reliably benchmarked through time. 

Teams need only set up a benchmarking dashboard to define which internal and competitor publications they want to track. Then the dashboard can be referenced any time for a simple view of a publication’s performance. Instead of the heavily manual work that teams had to endure before, Compass brings precise and consistent performance measurement and real-world benchmarking across assets or disease areas, giving teams the evidence needed to understand what’s working and where science is influencing practice.

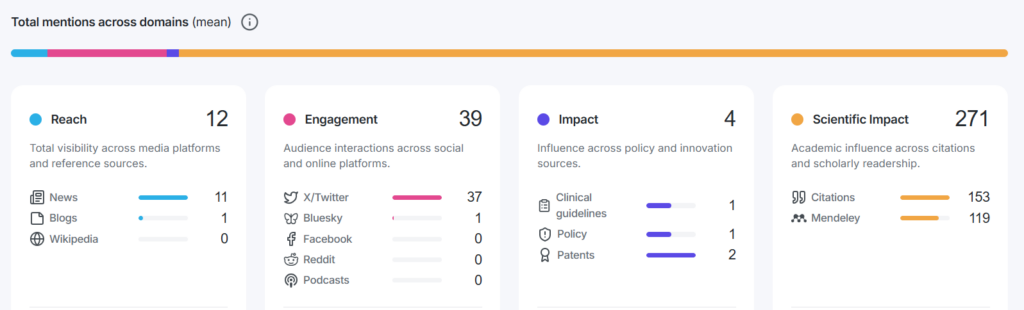
Figure 2: Total mentions across domains.

Democratizing data-driven publication strategy

Medical Affairs teams are too-often forced to rely on costly and slow agency relationships to understand how their publications are performing. Teams who can take these tasks in-house with tools such as Compass will amplify the efficiency and agility with which they can work. 

Compass performs three functions which are critical to creating a truly bespoke, data-driven publication strategy

  • Unified, easy-to-reference metrics: Compass allows teams to quickly and consistently track performance through time to understand if a publication has reached the right people.
  • Custom benchmarking: Teams can benchmark publications against their own portfolio’s historical performance, establishing what a realistic result looks like. This exercise can also encompass competitors and specific therapeutic areas, helping teams identify opportunities and learnings. The task of surveying channels and creating internal and external benchmarks would have taken weeks before—now, once a dashboard is created, it takes just a few minutes to check.
  • Self-service interface: Compass creates shareable, stakeholder-ready visuals to clearly demonstrate the direct impact of work to decision-makers and support resource discussions with concrete data points. Teams can cut and re-cut data in a few minutes, saving the time, cost and hassle of looping in an agency every time a new report is needed.

Instead of waiting for an agency to return a report, or spending hours parsing data only for it to immediately stale, Compass places the power of real-time insights in the hands of the people best placed to wield it, streamlining the distribution process and supporting decision-makers with clear targets and performance measurement. 

Use case: Moving from lagging indicators to real-time feedback

Take a mid-size oncology-focused biopharma preparing to launch a publication for a second-line therapy. The Medical Affairs team’s usual process might take three to four weeks per reporting cycle: they would need to pull citation counts from one system, social and news mentions from another, then manually reconcile both in spreadsheets. If socials spiked after review had concluded on a given platform, that data would be missed. This means by the time a report reached leadership, the data would already be stale, and there would be no consistent way to benchmark the publication against prior launches in the same therapeutic area, because citations move too slowly and social media moves too quickly. 

For this team, Compass is designed to remove the manual burden of the benchmarking and tracking process. The team would first set up their benchmarking dashboard, tracking both the performance of previous portfolio publications and those of competitors working in specific therapeutic areas. Then, it would take just a few minutes to monitor performance: the team would easily be able to track journal citation activity against historical norms for the launch stage alongside engagement on clinician-focused social platforms and podcasts. 

Teams would be able to see where the research was finding the most resonance and quickly take action on that basis, for example, redirecting a portion of dissemination budget towards channels demonstrating traction. The consistency of this data also makes it easy to keep leadership informed; teams can slice and share reports from their Compass dashboard to illustrate what’s working and what isn’t. 

For teams that have previously relied on a single lagging metric, having a live, multi-channel benchmark can turn publication planning from a retrospective, best-guess exercise into a real-time, data-driven strategy.

The future of Medical Affairs is here—it’s time your strategy caught up

The proliferation of scientific information through popular channels is a good thing. 

That new scientific and medical information can reach much wider audiences through a variety of channels undoubtedly has a net positive impact on patient outcomes. Patient and rare disease advocates, healthcare practitioners working in remote or underfunded areas, and even patients themselves all benefit from having access to the cutting edge science that will shape the future of medical care. 

But the result of this proliferation has been a significant challenge for publication planners—no one could’ve predicted the rise of peer-reviewed podcasts. Now, teams need to take all of these data points into account when measuring performance and planning future publication launches. 

Manually compiling point-in-time data is a time-intensive process that puts publications at a disadvantage and undermines strategic and patient outcome objectives.

The right strategy is one entirely specific to a given publication—it must be tailored to relevant journals, audiences and channels, and these may all change through time. To date, with this level of nuance, it wasn’t possible for teams to keep up—not at the level of granular detail that could shape truly powerful publication strategies. 

Compass turns that complexity into an opportunity. 

The post No Gold Standard: Measuring Success in Medical Affairs appeared first on Digital Science.


from Digital Science https://ift.tt/2B3QOuq

From Writing the Rules to Building the Tools: Responsible Research Assessment in Practice

What does responsible research assessment actually ask of the people who build the infrastructure, rather than those who write the policy? In this post, Steven Hill traces the arc from DORA and the Leiden Manifesto through to the Barcelona Declaration, and sets out what the principles mean in practice for the tools that describe, discover, and measure research.

More than a decade ago, one of my first tasks in a new job was to advise on whether the organisation I had just joined, the Higher Education Funding Council for England, should sign the San Francisco Declaration on Research Assessment (DORA). We did, as a founding signatory, and it was the right decision. DORA’s central claim is that metrics, especially the journal impact factor, should not stand in as a proxy for the quality of an individual piece of research. As well as being right, that principle was an important signal that the UK’s national research assessment process was not taking a reductive approach to research quality.

What has stayed with me from that period is not the signing, but what came after. Alongside committing to an expanding set of principles building on DORA, the research system needs the patient work of turning those principles into reality. The Metric Tide, and its follow up seven years later, were in large part an attempt to take that problem seriously, and coined the term ‘responsible research assessment’, which labels the movement. The arc from DORA through the Leiden Manifesto, the Metric Tide, the Hong Kong Principles, the Coalition for Advancing Research Assessment (CoARA), and, most recently guidance from the Global Research Council (GRC), is the story of the global research community moving from declaration to implementation. The GRC, which brings together the heads of science funders from around the world, has provided funders with both tools to assess their own performance and a practical guide to making the changes needed in their practice. And the SCOPE framework for research evaluation offers a process for thinking through responsible research assessment in any evaluation context.

I find myself thinking about all of this again, but from an unfamiliar direction. For most of my career I have been a policy-maker, writing the principles and fretting about whether anyone is following them. At Digital Science I now look from a different direction: the building of the tools through which research gets described, discovered, and measured. Both setting the policy environment and helping to shape the tools bring power and responsibility, but the potential and the pitfalls are different.  The shift in vantage point raises a question: what should responsible research assessment ask of the people who build the infrastructure?

What the Principles Ask For – and What They Don’t

It is worth being clear about what responsible research assessment is, because it is easily caricatured. It is not a rejection of measurement, and it is not a plea to return to pure peer review uninformed by data. Read across DORA, the Leiden Manifesto, the Metric Tide, the Hong Kong Principles, and the CoARA agreement, and a consistent core emerges. Assessment should rest primarily on qualitative, expert judgement, with peer review at its heart, supported, not supplanted, by the responsible use of quantitative indicators. It should judge the work rather than the venue it appeared in. It should recognise the genuine diversity of what researchers produce and do: not only papers, but data, software, mentoring, peer review, public engagement, the often invisible labour of the people who make research possible. And it should be sensitive to context, to discipline, to career stage, and honest about its own limitations. Finally, as emphasised by the SCOPE framework, it is also important to critically reflect on whether evaluation is needed at all.

It is also fair to say that commercial entities in the research evaluation space are often criticised in discussions about responsible research assessment. The Leiden Manifesto asks that the data and the methods behind indicators be kept open and transparent, so that those being evaluated can verify them. CoARA goes further, calling for the research community to retain ownership and control of the infrastructure and the criteria used to assess it, and is openly wary of proprietary “black boxes”. The most recent Metric Tide review is blunt about the harm that commercial university rankings—built outside the academic community—continue to do to research culture.

Some of these critiques can be valid, although there are real practical challenges in realising total community ownership of data and infrastructure. And comparative analytics, well constructed and appropriately used, have a place in benchmarking universities. There is also the question of how commercial providers respond to responsible research assessment. The tools and the data are not going away; the question is whether they pull in the direction of the principles or against them. That is the real issue, and it should be the focus of the people who build the infrastructure, whether commercial or not, alongside the people who write the policies.

Why Openness Comes First

At Digital Science, colleagues here have been wrestling with this in public, through the lens of the Barcelona Declaration on Research Information. The Declaration’s first commitment is to make openness the default for the research information we use and produce—the records of who did what, where the money went, how outputs and contributions connect to one another—and to support the shared, open infrastructures that hold it. Writing on this blog, our CEO Daniel Hook has made the case that researchers have a fundamental right to access the metadata about research, and that the data used to evaluate academics should be transparently available and reproducible. He also argues that there are questions of assessment and measurement that will need data that is costly or complex to collect, and that openness might not be possible in this case. I think considering the balance and tension is the right direction, and it is worth dwelling on why, because open research information is the hinge on which the whole argument turns.

The responsible-metrics principles are simply not achievable on top of closed, unverifiable information. You cannot ask people to trust an assessment built on data they are not allowed to see. Open research information is the precondition, not an optional extra. But openness on its own is not enough. My colleague Simon Porter has written, again on this blog, about our responsibilities as consumers of metadata, not just producers of it. Use of research information needs to take into account the context in which it was generated, its provenance, and the extent to which the sources of information can be trusted, not just its availability. Information that is not accurate or appropriately contextualised can disrupt human judgement rather than support it. Simon also rightly notes potential equity concerns, where the metadata rich get privileged over the metadata poor, undermining the diversity and inclusion principle inherent in responsible assessment. He also notes that, as well as the responsible use of research information, responsible collection of data is also important.

Putting Principles into Practice

How does a commercial research infrastructure provider understand its role in supporting responsible research assessment? Rather than consider Digital Science’s products one by one, I want to focus on the principles of responsible research assessment and highlight examples where our tools and other options are aligned.

Broadening what counts. Research is more than journal articles, and the infrastructure has to be able to see and recognise a broader range of outputs. Being able to give a dataset a persistent identifier and a home, to surface software and preprints and policy documents alongside papers, to connect grants and patents and clinical trials into a fuller picture of a contribution is at the heart of responsible assessment. Digital Science tools such as Symplectic Elements, Figshare, and Dimensions, and the tools and work flows that they enable, are useful here precisely to the extent that they make the diverse outputs visible and creditable.

Supporting judgement rather than replacing it. The most valuable thing a system can do is not to produce a number, but to assemble as broad a view of the available evidence, so that human beings can exercise judgement well, and a researcher can tell their own story. Dimensions includes a range of tools that enable decision-makers to access clear summaries of the data and evidence that they need. Research information systems, such as Elements, that support narrative and evidence-based CVs, and that spare people the indignity of re-keying the same information into yet another form, are doing something genuinely in the spirit of the reform. The recently introduced CV import capability in Elements contributes directly to this objective.

Many dimensions, not one. When Altmetric first appeared, its real purpose was not to provide a new “score” but to emphasise evidence of broader contributions beyond those measured through citations. Evidence of attention in policy documents, in the press, in clinical guidance tells you something a citation count cannot. Links between publications and patents and policy documents in Dimensions also provide this richer picture of research. Outside of the Digital Science product line, Overton also provides data on the rich connections between research and policy.

Transparency and context. This is where the Barcelona Declaration is important, and Digital Science’s Open Principles set out how we work to align our tools with its aims. Making core elements of the Dimensions and Altmetric datasets freely available sits at the heart of these principles, alongside our commitments to work with the research community, and to openly publish our thinking and research. For example, where Dimensions data are used for assessment purposes researchers and their employers can check and verify the data. Our data sits alongside other open sources such as Crossref and DataCite and persistent identifiers like ORCID and ROR, key parts of the open responsible research assessment infrastructure. OpenAlex also offers fully open information as a secondary aggregator, overlapping in some areas with Dimensions.

I have spent enough time on the policy side to be wary of believing that any of this can be solved by better tools alone. Responsible research assessment is about behaviours, norms and incentives as much as it is about systems and infrastructure. And the choice isn’t between commercial infrastructure and community-owned systems. What matters is that infrastructure is built and used in a way that supports human judgement, broadens what we value, and submits itself to transparency and scrutiny. This is what responsible research assessment asks of those who build the infrastructure, and should inform everything we do at Digital Science.

The post From Writing the Rules to Building the Tools: Responsible Research Assessment in Practice appeared first on Digital Science.


from Digital Science https://ift.tt/9kBIOJf

Why Your AI Agents Are Only as Good as the Knowledge Behind Them

The race to deploy AI agents is accelerating, but most organizations are still building on sand. A new Gartner report suggests that the key to building reliable AI agents is a “context layer”.

According to Gartner’s latest research, 42% of enterprises plan to deploy AI agents by the end of 2026, and AI agent spending is expected to grow from 22% to 31% of total AI budgets in just one year1. Despite this wave of investment, only one in five organizations report that their GenAI tools are delivering significant value. Hallucinations, limited impact, and unpredictable behavior remain stubbornly common.

The problem, Gartner argues, isn’t the models, but rather what surrounds them.

The Missing Layer

Behind every reliable AI agent is something Gartner now calls a “context layer”— a dedicated architectural component that curates, organizes, and delivers the knowledge an agent needs to act intelligently. Without it, agents are left processing noisy, poorly prioritized data, making expensive errors and producing outputs that can’t be trusted or traced.

Gartner is unambiguous about the stakes: by 2027, organizations that prioritize semantics in AI-ready data could increase their agentic AI accuracy by up to 80% and reduce costs by up to 60%. The context layer is no longer an optional refinement — it is the necessary foundation.

And yet this layer cannot simply be purchased. No vendor offers it out of the box. It must be engineered, assembled from services, capabilities, and custom modeling that together transform an organization’s tacit knowledge into something AI agents can actually use.

Three Components, One Foundation

As stated in the report, there are three interlocking components that make up this ‘context’ layer: semantics, operational state, and provenance. Together, they form a pipeline that allows agents to retrieve the right information, organize it coherently, and act on it with accountability.

Semantics: Meaning, Not Just Data

Semantics is the component most organizations are missing, despite it being the one with the greatest leverage. Gartner finds that organizations implementing semantic modelling such as ontologies and knowledge graphs, are 2.2 times more likely to achieve high effectiveness in AI data engineering, however, only 40% of organizations have done so. 

Semantics means representing your organization’s knowledge—business entities, rules, policies, relationships, metrics—in machine-readable form. This allows AI agents to interpret what something means in context and execute an action based on that context, not just pattern-match on keywords. Without this layer, even the most sophisticated agent is, in effect, guessing.

This is precisely the domain where metaphactory brings long-standing proven capability. metaphactory by metaphacts, a Digital Science solution, is a knowledge graph platform enabling organizations to build and maintain rich semantic models for over a decade—connecting business glossaries, ontologies, and data products in ways that AI agents can directly leverage. For organizations serious about agentic AI, a robust semantic foundation isn’t a future aspiration; it is a prerequisite.

Operational State: The Right Information at the Right Time

While semantics provides meaning, your operational state provides situational awareness. AI agents need access to current, accurate information about the entities and processes they’re acting on beyond just snapshots, such as up-to-date information on customers, datasets, experiments, publications and suppliers. 

For research-intensive organizations, this is particularly acute. The ‘operational state’ of a research environment spans live datasets, ongoing experiments, researcher expertise, institutional repositories, and the evolving landscape of published science. Digital Science’s portfolio—including Dimensions, Altmetric, and Figshare—represents exactly this kind of curated, continuously updated operational knowledge. Rather than building this knowledge from scratch, organizations working in research and innovation already have access to a pre-assembled foundation.

Gartner also highlights the Model Context Protocol (MCP) as the emerging standard for connecting agents to operational state efficiently and securely. Dimensions, Altmetric, and metaphactory already support MCP, reflecting a broader conviction that research infrastructure should be designed to meet agents where they are, not retrofitted after the fact. As adoption of the protocol grows across the industry, having well-structured knowledge accessible through it will matter more, not less.

Provenance: Trust Through Traceability

The third component—provenance—is what makes agentic AI governable. It encompasses the systematic tracking of data lineage, agent decisions, actions, outcomes, and feedback across the full lifecycle of AI operations.

For research organizations, publishers, and funders, provenance isn’t merely a governance checkbox. It is central to the integrity of the work itself. Reproducibility, accountability, and the ability to audit AI-assisted conclusions are not simply peripheral concerns; they are defining ones. Gartner notes that 74% of organizations recognize that data governance tools are essential to operationalizing AI governance, yet robust provenance mechanisms remain rare in practice.

Digital Science’s longstanding commitment to open, traceable research infrastructure, including persistent identifiers, transparent data lineage and open metadata, gives research organizations a natural head start on this component. The challenge is connecting these capabilities explicitly into the agentic architecture, so that every AI-assisted decision can be traced back to its sources and reviewed.

Research Intelligence as a Context Layer

There is a broader framing worth making explicit here: for organizations operating in research, science, and innovation, the context layer is not merely a technical architecture problem. It is, at its core, a research intelligence problem.

The tacit knowledge Gartner describes—the organizational understanding that must be made machine-readable for AI agents to function—is, in a research context, the accumulated intelligence of a scientific community: what has been discovered, by whom, with what methods, validated how, and applied where.

We have spent over a decade building infrastructure that captures precisely this kind of knowledge at scale. The shift to agentic AI doesn’t make that infrastructure less relevant—it makes it more so. The question is no longer just “can researchers find the right information?” but “can AI agents, acting on researchers’ behalf, find, interpret, and act on that information reliably and accountably?”

The answer depends entirely on the quality of the context layer underneath.

What This Means in Practice

For R&D leaders and data and analytics leaders, the practical implication is this: before asking which AI agent to deploy, ask what context layer you have in place to support it. Gartner’s advice is to start with high-value use cases rather than attempting a comprehensive build all at once—iterate, demonstrate outcomes, and expand. That is sound counsel. But iteration without a semantic foundation, without right-time data access, and without provenance mechanisms will simply produce faster failures.

The organizations that will lead in agentic AI are not those that move fastest to deploy agents. It is the organizations that invest earliest in the knowledge infrastructure that make agents worth deploying.

Digital Science is working with research organizations and data-intensive enterprises to build the context layers their AI strategies require.


  1. Gartner. (2026). The 3 core components of the context layer for AI agents. [Research Note/Report]. https://www.gartner.com/document/ [G00848874]

The post Why Your AI Agents Are Only as Good as the Knowledge Behind Them appeared first on Digital Science.


from Digital Science https://ift.tt/1isBFqy

REF readiness: evidencing Contribution to Knowledge & Understanding

In the first blog in this series, we explored engagement and impact readiness for the Research Excellence Framework (REF) 2029. Here, we turn to the second element of assessment: Contribution to Knowledge & Understanding, and what it takes to approach it with evidence and confidence.

Contribution to Knowledge & Understanding (CKU) sits at the core of REF assessment. For institutions preparing submissions, the task is not simply to present strong individual outputs, but to show how research collectively advances knowledge within and across disciplines and how that work was enabled and supported within the institution’s research environment.

As REF 2029 approaches, most institutions will find that they are not short of high-quality research.  The task they now have is to present that research as a coherent, representative, and defensible account of contribution, traceable back to the people, grants, and infrastructure that enabled it.

That distinction matters more than it might first appear.

Beyond completeness

It is tempting to frame CKU readiness as a data completeness problem. If all outputs are captured, the argument goes, selection can proceed with confidence.

But completeness is not the same as representation.

REF panels assess whether a submitted body of work reflects the range and diversity of a unit’s research activity, not simply whether a record exists for every output. A dataset can be complete and still produce a submission that is narrow, uneven, or poorly contextualised.

“The challenge for universities is not simply about capturing and submitting quality research outputs to REF, it is about demonstrating the full diversity and breadth of the research outputs. In choosing which outputs to submit, universities are expected to demonstrate the diverse range of staff contributing to the outputs; the diverse range of disciplines, research methods and output types whilst also ensuring that contributions from inter- and multi-disciplinary collaborations are represented,” says Natalie Dallat, Head of Research Performance, Ulster University.

This distinction has practical implications. In a decoupled framework, where submitted outputs do not need to be linked to specific individuals, institutions still need to demonstrate a substantive connection between research and the environment that enabled it. That requires not just complete records, but well-contextualised ones.

Three areas of risk are worth examining in turn.

Output visibility: what institutions know and what they can prove

In practice, most significant outputs are already known to institutions. Academic workflows, open access deposit requirements, and internal review processes mean that the majority of relevant publications are captured somewhere.

The more common challenge is not absence but unevenness, gaps in coverage that accumulate over time through staff mobility, inconsistent author affiliations, publications linked to grants but not captured locally, and interdisciplinary outputs that fall between Units of Assessment (UoA).

Figure 1: University of Oxford, all publications 2021-present

These are rarely major gaps in institutional systems. But in aggregate, they can affect the completeness and credibility of a submission, particularly in disciplines where research activity may be systematically underrepresented relative to its actual volume.

Addressing this requires two complementary layers. Research information systems such as Symplectic Elements provide structured output capture, validation workflows, and linkage between researchers, publications and grants, creating the audit trail that REF governance demands. An independent, interconnected data layer such as Dimensions then enables cross-checking: surfacing missing outputs, highlighting metadata discrepancies, and providing a broader view of publication activity beyond local records.

“What Dimensions allows institutions to do is essentially hold a mirror up to their own systems. Not to replace internal records, but to ask: is what we’re seeing internally representative of what’s actually out there? For some disciplines or research groups, that comparison can be revealing,” explains Ann Campbell, Director Research Impact & Comparative Analytics at Digital Science.

Together, structured capture and independent validation strengthen confidence in completeness before output selection begins and provide a more defensible evidence base for the decisions that follow.

Understanding performance within fields

Once institutions have confidence in the completeness of their records, a second challenge emerges: interpreting performance in a way that is fair and defensible across disciplines.

Raw citation counts rarely tell the full story. Citation norms vary significantly across fields; what constitutes a well-cited output in a fast-moving biomedical discipline looks very different from the equivalent in history or architecture. A paper with 20 citations might be considered relatively modest in one field, but well above average in another. 

While output selection is typically led by discipline experts within UoA, decisions are often informed by broader portfolios and mixed indicators. Without appropriate field-level contextualisation, there may be tendency to overvalue some outputs that align with readily interpretable patterns of performance (i.e., citation counts) and undervalue others particularly where interdisciplinary research is involved. This can have consequences both for selection and for the narrative presented to panels. 

The scale of this variation is visible in the data. Across UK institutions, raw citation counts for outputs in Units of Assessment such as Clinical Medicine or Physics far exceed those in disciplines like History or Art & Design, and yet when performance is measured relative to field norms, the picture shifts substantially. Units that appear modest on raw citations often demonstrate strong or above-average relative contribution when field-normalised indicators are applied. For institutions making selection decisions across multiple UoAs, this difference is not academic: it directly affects which outputs are recognised as genuinely competitive, and which risk being undervalued simply because they sit in lower-citation disciplines.

Figure 2: Average citation counts vary substantially across Units of Assessment, while field-normalised performance (FCR) highlights strong relative contribution in disciplines where raw citation accumulation may be lower. *

*  Average citation counts and field-normalised citation performance across REF Units of Assessment (2014–2021, UK Institutions, articles only using Dimensions UoA Classification) 
Figure 3: Average Citation Count per Publication

Field-normalised indicators and disciplinary benchmarking support a more accurate and defensible reading of performance. Dimensions enables field-normalised citation analysis, benchmarking against peer institutions, collaboration pattern analysis, and trend tracking across time.

Peer review remains central to CKU assessment. But contextual data helps institutions approach that peer review better prepared with a clearer sense of where their research sits within its field, and a stronger basis for the interpretive narrative they are expected to provide.

From individual outputs to coherent thematic narratives

CKU submissions are strongest when outputs form a coherent intellectual narrative. Panels respond to thematic depth and sustained advancement of knowledge not isolated high-performing items, however well-cited they may be.

That makes output selection a genuinely strategic exercise and the scale of the choices involved is considerable. Analysis of REF21 submission patterns shows that the typical institution produced eligible research across 33 of the 34 UoA, but submitted to just 20. In nearly one in five cases where an institution had a meaningful body of research within a UoA, that UoA received no submission at all. Even within the UoAs that institutions chose to submit, the median coverage rate was under 7%.

Figure 4: Research breadth vs submission breadth

The submitted profile, in other words, represents a deliberately selective slice of a much broader underlying research base. That selectivity is appropriate as REF rewards quality over volume, and strategic narrowing is both permitted and expected. But it means the submitted body of work must tell a coherent story about where an institution’s research genuinely lies. Getting that story right requires a clear view of the full landscape: understanding where depth is concentrated, where disciplines connect, and where gaps might undermine the coherence of what is presented to panels. 

Thematic clustering and citation network analysis can help identify areas of concentrated strength and the interdisciplinary bridges that connect them. These analytical approaches surface patterns that may not be visible when outputs are reviewed individually, and support the kind of coherent story that distinguishes a strong CKU submission.

That coherent story, however, increasingly needs to account for more than publications alone. As REF increasingly recognises diverse outputs, datasets, code, preprints, and other research artefacts alongside traditional publications, institutions also need infrastructure that makes that breadth visible and accessible. 

The evidence from REF21 illustrates how far there is still to go: of the 4,000 non-traditional outputs submitted, almost three quarters had unknown or unresolvable locations, and only 244 had DOIs. REF21 Main Panel D assessors noted the wide variety, inconsistent quality and uneven preservation of practice-based outputs with many hosted on fragile, short-lived platforms that were difficult to navigate. 

Platforms such as Figshare support persistent access, DOI assignment and the presentation of these materials as part of a coherent research record, ensuring that the full range of contribution is available for assessment.

Scholarly visibility: useful context, not a proxy for contribution

While CKU is fundamentally about intellectual contribution, the broader circulation of research can provide supplementary context. Where outputs are being cited in policy documents, taken up in professional practice, or discussed in specialist communities, those signals can help situate the reach of a body of work, particularly in applied or interdisciplinary fields where impact pathways are diverse.

Altmetric can surface where outputs are being referenced beyond traditional citation indexes, from policy and clinical guidelines to media and public discourse. These signals do not measure contribution to knowledge and understanding, and should not be presented as a substitute for bibliometric evidence or peer judgement. But as additional context, they can help round out the picture, particularly for outputs whose significance may not be fully reflected in citation metrics alone.

The important distinction is that scholarly visibility supports interpretation. It does not replace it.

From reactive selection to confident CKU readiness

CKU readiness is about planning, not last-minute correction. Institutions that approach it most effectively don’t wait until selection is imminent. They build the evidence base over time, ensuring completeness, contextualising performance, and constructing the thematic narrative that panels expect to see. 

“What we often see is that institutions feel more confident in REF preparation when they’ve been building the picture gradually over time. It becomes easier to understand where strengths are emerging, how research sits within its field, and how to present that contribution coherently,” says Campbell.

REF readiness is about leading, not lagging. For CKU, that means investing in the evidence and infrastructure and contextual understanding that supports selection throughout the cycle. 

Institutions preparing for REF29 are increasingly focusing on areas such as: 

Together, these form the building blocks of a CKU submission that is traceable, representative, and defensible.

Digital Science supports this readiness through interconnected solutions that strengthen evidence and decision-making, while leaving judgement firmly with institutions and REF panels.

Whether you want to audit output visibility and identify gaps in your publication record, benchmark your CKU evidence within disciplinary context, or map the thematic strengths that will anchor your submission narrative, Digital Science can help.

The post REF readiness: evidencing Contribution to Knowledge & Understanding appeared first on Digital Science.


from Digital Science https://ift.tt/s7nJBkc

From The Lancet to TikTok: Benchmarking success for publication strategy in medical affairs

Scientific communications have never traveled so far so fast. Medical affairs teams need an omnichannel approach to planning and monitoring publication strategy.

Compass Points: The Future of Medical Affairs is a series exploring the strategic challenges facing medical affairs teams in today’s communication landscape—and the tools that will help them get it right. 

The goal of everyone working in medical affairs is ultimately to improve patient care. But success is contingent not only upon the research, trialing and production of innovative treatments; it depends equally upon the firm’s ability to educate on the suitable applications of a new treatment and establish trust within healthcare environments.

If healthcare practitioners don’t know a better treatment or diagnostic exists—or if they do, but they don’t trust it—they won’t use it in treatment plans. This has implications for the quality of patient care and commercial impacts for the firms creating those new treatments.

But the chain of communication is more fragmented and complex than it has ever been, and this makes identifying and monitoring how information travels difficult. In order to make sure information is reaching the right people in the right places, medical affairs teams need benchmarking and measurement tools, like Compass by Dimensions, which are capable of processing the rich, complicated reality of the communication landscape today. 

How does scientific information travel?

Up until the recent decade, it was common for a healthcare provider to learn about new treatments and come to believe in their legitimacy after reading about them in a respected journal. This was a typical part of a clinician’s day, and reflects the supremacy of journals such as The Lancet or the New England Journal of Medicine, which is still entrenched today.

In recent years, scientific breakthroughs have found purchase across more diffuse channels, such as newspapers, radio and television. Now, scientific information is disseminated in every direction—both via “linear” one-to-many channels such as journals and also rhizomatically, across low-frequency networks such as social media, podcasts, internet forums, and word of mouth. 

This has the undeniable benefit of bringing critical information to wider audiences, often with tremendous speed, but these channels lack the legitimacy of the big journals. 

A new approach to scientific communication

Everything from peer-reviewed podcasts and video abstracts to plain language summaries and audience-segmented data now form a critical part of scientific communication. Where before this information could only travel in the rarefied air of prestigious journals, today, important research outcomes are accessible to audiences beyond academics and even beyond healthcare professionals. 

This is a positive trend; these popular channels open research findings and awareness to patients and advocates—who, in rare disease settings, are often the best-informed in a given room.

Publication planners should embrace the potential that comes with this reality; with it comes the opportunity to reach new markets and to better influence treatment protocols even in remote fields. 

For example, isolated clinicians in dispersed healthcare environments are historically among the hardest to reach and among the most likely to be using outdated treatments. They may not be reading The Lancet. They may not be at the big conferences. But if those clinicians encounter a new treatment option in a mid-tier journal, in a podcast, on social media, and in a clinical newsletter, they may change their prescribing behavior. 

In these popular channels, trust and legitimacy is assigned instead by the opinion leaders who share about medical or scientific topics. The speed with which information travels and nature of the conversation it elicits can color its reception—making monitoring each type of channel all the more important. 

Without a clear view of this data, medical affairs risks unsuitable communications plans that fail both the commercial objectives attached to a given asset and the people they intend to help with it. 

How can measuring publication performance impact commercial and medical objectives? 

Scientific information is traveling in novel ways. It is an entirely new challenge for publication planners and communications professionals to attempt to parse, measure, and analyze this data so that they may better design future communications strategies.  

To know if you’re succeeding, you first need to know what success looks like. 

In the 1980s, success could be measured in citation counts. This was appropriate as journals were a primary mode of scientific communication. Today, the gold standard for measuring how information travels and resonates is fuzzier. 

Planners know that omnichannel communication forms a critical part of a robust publication strategy. But to date, there hasn’t been a simple way to collate a unified view of research impact across the spectrum of communication channels at play. 

So, planners often still rely on citation counts, as these are concrete and reproducible as a measurement. But they reflect academic attention almost exclusively and obscure the impact of a given asset outside of these narrow academic channels. Weaving in altmetrics is a highly manual process, where planners must stitch together sources such as mentions on social media, broadcast media and journals. This practice is time consuming and difficult to rely upon because it is so difficult to standardize and view in aggregate. Online conversation might move in ways that are impossible to predict or track, making metrics difficult to compare and learn from.

But pressure for hard numbers and clarity is growing. High-quality research that fails to reach its audience is, commercially, wasted investment. Research that doesn’t travel can’t shape clinical awareness, influence prescribing behavior, or support often costly distribution activities. Planners need a single, unified view of total scientific impact which they can rely upon.

How should medical affairs teams build publication strategy?

To know a given communication is having the desired effect, planners need a view of three things:

  • Reach: is information propagating across relevant networks, i.e., news, social media, podcasts, clinical commentary
  • Engagement: are the intended audiences engaging with the research, and how are they talking about it
  • Impact: is there evidence of the therapeutic conversation or relevant policies shifting 

The performance data needed to answer questions of reach and commercial viability exists. But the fragmentation of social platforms adds complexity—monitoring must now span X, BlueSky, Reddit, and beyond—but the richness of this data is unprecedented and therefore invaluable. 

Compass tracks reach, engagement and impact and provides an overall view of scientific impact, so planners tracking alternative metrics can identify, track and analyze trends over time. From there, they can use aggregate views of asset performance as jumping off points for sentiment analysis and deeper audience research.

See how publication attention is distributed across domains

Having this data to hand makes publication strategy an endeavor of cause and effect rather than guesswork—seeing where research has resonated particularly well or potentially missed the mark informs each subsequent communications plan. 

Why is benchmarking so important in medical affairs publication strategy?

Understanding your own reach and engagement is important, but without a point of comparison, it’s impossible to know whether a result is strong or where resources are well spent. Benchmarking performance—understanding what reach, engagement impact looks like per therapeutic area—against internal track records and those of competitors must form a central tenet of publication strategy.

Medical affairs teams must benchmark in two directions. 

The first is competitive benchmarking: understanding how your publications and communications are performing relative to peer firms working in the same therapeutic area. This type of benchmarking helps identify gaps in therapeutic discourse along with spaces that are already crowded, helping planners tailor and prioritize their approach.

Monitor top-performing publications by their Altmetric attention score and citation count

The second is industry benchmarking: understanding how your publication performance compares across therapeutic areas and channels. What does a typical volume of clinical engagement look like for the launch of a publication? What level of social chatter is reasonable to expect from a given journal tier? What rate of sentiment shift can be linked to momentum within therapeutic environments?

Compare publication performance against selected disease area or drug benchmarks

In short: benchmarking defines how we might judge success. Together, competitive and industry benchmarking transform measurement from a simple reporting exercise into a strategic one. They make it possible to set meaningful publication targets, track progress against them, and align publication activity with clinical trial milestones and other medical affairs priorities.

Ultimately, being able to access, monitor, and derive insights from this data will deliver not only a critical competitive and strategic advantage; it will help ensure information is reaching the people who need it.

“The proliferation of communication channels, and the increasingly diverse ways in which HCPs gather and share information about treatments have resulted in a very dynamic and complex impact environment. Compass from Dimensions represents a significant step forward in simplifying how we understand and communicate the values of our omnichannel strategies.”—Mike Taylor, Head of Information & Analytics, Digital Science

Compass was designed to help answer these questions of impact. Built on Dimensions and Altmetrics data, Compass combines publication and altmetrics into a single collaborative workflow, simplifying how medical affairs teams benchmark, track and manage publication impact and reach. Compass by Dimensions is developed by Digital Science, an AI-focused technology company that transforms fragmented data into unified knowledge assets, leveraging AI and Knowledge Graphs to deliver structured, actionable intelligence for high-value discovery and innovation. By combining unparalleled data depth and breadth with enterprise-ready AI technology, we help leaders confidently accelerate product life cycles and secure a decisive market lead.

The post From The Lancet to TikTok: Benchmarking success for publication strategy in medical affairs appeared first on Digital Science.


from Digital Science https://ift.tt/kVcIj1W

Why the future of Pharma data can only be FAIR

FAIR data is a defining component for a future-proofed pharma or life science enterprise. But what is FAIR data, and how can data be made FAIR? We explain how knowledge graphs achieve FAIR data to accelerate discovery, overcome regulatory hurdles, and supercharge AI you can trust.

AI is transforming the pharma and life sciences industries and the market for AI in the pharmaceutical industry is projected to reach $13.1 billion by 2034. Within the drug development process alone, the application of AI is expected to shorten drug-to-market timelines from 5-7 years to as little as 12-18 months. The market is already awash with AI tools promising to revolutionize the industry – including OpenFold3, which helps researchers predict the 3D structure of proteins, and Chemistry42, a “generative chemistry” platform. 

But FAIR data is fundamental for successful AI. If data isn’t findable, accessible, interoperable, and reusable, then the quality of AI outputs is compromised, and money and time spent on AI projects is wasted. 

Knowledge graphs are conceptual models that visualize relationships between real-world objects and concepts. In this blog post, we pull key insights from the metaphacts video series Mind the Graph: Knowledge graphs in Pharma, featuring Peter Dörr, Director of PreSales at metaphacts (a Digital Science company), where he explores how enterprises in these industries are leveraging knowledge graphs to make their data FAIR and meet complex data needs across the whole value chain from R&D to clinical trials to manufacturing.

What is FAIR data and how do you achieve it?

“Knowledge graphs are there to make data FAIR.” But what exactly is FAIR data, how do knowledge graphs achieve FAIR data and why should FAIR data matter to industry leaders? 

The FAIR principles are guidelines published in the Scientific Data journal, which emphasize machine-actionability. The acronym stands for Findability, Accessibility, Interoperability, and Reusability. These are guiding principles that are applicable to data architectures across all industries, and are especially beneficial for industries that are data-intensive and strict regulatory and compliance requirements. 

Knowledge graphs make data findable because they standardize cataloging and provide a unified metadata layer. As Peter explains, it’s not just the knowledge graphs in of themselves that achieve FAIR data. When there is a semantic layer underpinning your knowledge graph, the semantic layer explicitly defines business objects, they bridge the semantic gap (where machines or humans interpret the meaning of an object differently, misinterpreting each other). This makes data accessible

Often built on open standards, like RDF, OWL and SKOS, knowledge graphs help companies to create a machine-readable “digital twin” of their organization’s data landscape – meaning that data is rendered interoperable, and computer systems or software are able to easily exchange and make use of the information. 

Finally, because knowledge graphs aren’t static, they can be easily repurposed and reused. Because knowledge graphs don’t include a fixed database schema, they are more like a living map of your data, which extends and changes as you add new insights. This is unlike traditional databases, where data is stored in rigid tables, and new questions require an upheaval of the existing data structure.

Imagine you build a graph to successfully map the Genomic Targets for a rare disease. When you want to map the Genomic Targets for a new disease, using the knowledge graph, you can simply layer in the clinical trial data for the new drug. This saves potentially months of work on data migration and schema redesign.  

FAIR pharma data is AI-ready pharma data

“Un-FAIR data creates unsuccessful AI projects.” In the pharma and life sciences industry, unsuccessful AI projects create dead ends, and time-intensive applications of tools that fail to return meaningful ROI. Unfortunately common. But when clearly structured, machine-readable FAIR data is fed to AI, the output is high-quality and traceable. 

Tools like ChatGPT and Gemini AI are already being used by many employees in the pharmaceutical industry. However, LLMs are not fully-trusted sources of information. Because there is no clear trail of where information was sourced, standalone LLMs provide untraceable answers. This “black box” effect means that even the creators of LLMs are unable to explain how their models arrive at their answers. In an environment where trust is key, using ungrounded AI is a dangerous game.

The consequences of misapplied AI in the pharma industry are especially severe. AI hallucinations can potentially result in life-or-death mistakes. In fact, a report by SwissRe predicted that in 2032-34, the health and pharma industry will be most at risk of AI misappropriation. Misappropriation of AI might include citing a non-existent clinical study during the drug development process or relying too heavily on the speed and convenience of AI outputs, and shirking necessary due diligence. For example, fast-tracking a drug to market despite having overlooked its potential for long-term toxicity. 

FAIR data is designed to make data machine-readable and AI-actionable. Unlike generic LLMs, by grounding AI in knowledge graphs and FAIR data, the results are transparent and traceable. This detailed metadata provides the explainability needed to ensure pharma and life science companies can trust their AI outputs. One of the benefits of building knowledge graphs with metaphactory is not only that the results are AI-optimized, but that metaphactory is a frontrunner in utilizing AI to simplify building and querying the data.

Unlock insights and bridge-silos with FAIR Data

Although pharmaceutical companies share many of the same data challenges as any large organization, Peter isolates two main pain points in the industry. One is that pharma is a science-driven industry, and science creates a lot of data.

And disconnected data from different labs and publications not only slows down research and development, but data silos undermine efficiency across every operational stage. 

For example, Peter illustrates, if you want to repurpose a drug and you fail to connect two relevant research papers, you miss a huge opportunity. Expensive approaches like migrating fragmented data to central repositories like data warehouses and lakes can end up being time-consuming and inflexible. Point-to-point integration is difficult to scale and both approaches ultimately fail to provide the holistic point of view necessary to truly mitigate data silos. 

Because FAIR data uses standardized ontologies, data from different labs, systems and even across different geographic locations and languages can be integrated together harmoniously without great expense or time. Rather than wasting time searching for data, or missing out on data opportunities, or wasting time evaluating unnecessary information and resources already available within the organization, having a “digital twin” of the company’s data modeled in a semantic layer means that data is findable and usable, even to those with limited technical expertise.

One of the successes Boehringer Ingelheim, a German pharmaceutical company, achieved by using metaphactory is that researchers are now able to gain insights and make discoveries much faster than before. This is because their knowledge graphs now provide a holistic and navigational view of their data.

Not only do knowledge graphs help map internal knowledge, but life science and pharma companies also have the option of tapping their internal knowledge into the Dimensions Knowledge Graph

The Dimensions Knowledge Graph captures 350 million semantically annotated and linked records of global research, and enables integrations with public datasets and ontologies.

Besides the exploration of public datasets, exchanging knowledge with external companies or even competitors can be mutually beneficial. Pre-competitive knowledge sharing in biotech and pharmaceuticals accelerates the discovery of solutions to shared problems. One example of this type of valuable collaboration is ICODA (International COVID-19 Data Alliance), a global initiative in response to the COVID-19 pandemic.

But as Peter explains, this could pose its own regulatory and data privacy concerns. In these scenarios, knowledge graphs enable collaborators to exchange only the required metadata, and make case-by-case access decisions. All of this can be visualized in individualized dashboards, which can be tailored to specific needs by asking natural language questions to generative AI.

Stress-free compliance with FAIR data and knowledge graphs

As we just touched on, another concern at the top of the pharmaceutical industry agenda is regulation. To keep patients safe and their medical data secure, regulatory requirements are high.

Companies are beginning to realize the benefit of drawing upon personal data from wearable devices, electronic health records and insurance claims to inform their decisions and monitor efficacy. But more personal data means greater responsibility and pressure to meet regulatory standards. 

Although regulatory agencies encourage the use of real-world evidence (RWE), enterprises must ensure that this real-world data satisfies the stakeholders involved in regulatory policies and guidelines, including government agencies, NGOs, and health tech assessment agencies.

In one case, an unexpected, but simple request from a regulator to provide information on a single ingredient sent one pharmaceutical company on a long, labor-intensive journey to satisfy the request. Why did it take so long? Because they had un-FAIR data. 

FAIR principles provide a complete, machine-readable audit trail of a company’s data. This simplifies regulatory processes and ensures that data meets industry standards. Taking an example from another company, one success of Boehringer Ingelheim’s knowledge graph architecture is that now, regulatory tasks are simplified as compliance can align internal direct product data with their EMA product database.

FAIR data and knowledge graphs provide the structured, flexible and comprehensive solution to manage the vast amount of data collected day to day in the pharma and life science sectors. Taking another real-life example, one Swiss healthcare company used metaphactory to build a FAIR in vivo data sharing platform. This allowed researchers, bioinformaticians, and lab scientists to browse, search, access, and extract meaningful insights obtained during preclinical studies whilst also preparing the data to meet regulatory submissions. 

AI-integration, silo mitigation and demanding regulation, simplified with knowledge graphs

The global pharmaceutical market is expected to reach 3.5 billion by 2035. But the companies that will claim the most from this growth won’t be the ones that throw the most money at AI, but the ones with the most reliable, FAIR data. 

More and more companies, like Boehringer Ingelheim, that are wise to this reality have built ontologies with the help of tools like metaphactory, and already reap the rewards of this technology. Meanwhile, competitors flounder in un-FAIR, AI-incompatible data landscapes.

In this blog, we’ve explored why FAIR (Findable, Accessible, Interoperable, Reusable) is the linchpin of any forward-looking data strategy. From accelerating discovery and uncovering hidden insights, to creating a machine-readable audit trail of data and closing data silos and bridging semantic gaps, knowledge graphs make data FAIR, and FAIR data is future-proofed.


Learn more about Digital Science’s data solutions for pharma and life science enterprises

AI-integration, mitigating data silos and satisfying regulatory requirements are just three easy wins of introducing knowledge graph architecture into your pharma or life sciences enterprise.

But this is just the start of what knowledge graph technology can help enterprises achieve. Since 2010, Digital Science has been working with organizations, including life science and pharmaceutical enterprises, to create tailored tools to foster innovation and collaboration. 

Digital Science has developed and refined solutions that super-charge the whole research lifecycle, whether safeguarding research programs, enhancing decision making, or showcasing the impact of research.

You can browse the full range of AI-enhanced tools here, or read more about how these tools are already being applied in pharma on our blog

Watch clips from the Mind the Graph: Knowledge graphs in pharma video series here.

The post Why the future of Pharma data can only be FAIR appeared first on Digital Science.


from Digital Science https://ift.tt/XJqb5p6

Research security is national security.

Global science is now a battleground for influence.

Modern global science has become a critical frontline for national security, yet many U.S. agencies remain caught in a “strategic paradox.”

While new federal mandates like Executive Order 14303 and the OSTP’s Gold Standard Science require deep vetting of research partnerships, traditional agency workflows are often ill-equipped to track complex, real-time affiliations in a landscape increasingly influenced by geostrategic competitors.

This creates a strategic gap where oversight mechanisms have failed to keep pace with the shifting realities of global collaboration and talent flows.

Quotes icon
U.S. agencies can no longer afford to operate with the operational handicaps of legacy research solutions.”

To address these challenges, agencies must shift from reactive risk management to proactive strategic oversight by adopting integrated, real-time research intelligence.

Digital Science’s Dimensions platform provides a secure, FedRAMP-grade solution that allows agencies to visualize institutional networks, flag indirect ties to high-risk entities, and verify researcher credentials.

By embedding these data-rich insights into daily decision-making, funding bodies can ensure national research remains a strategic asset without compromising scientific openness.

To learn more, check out our exclusive eBook, Securing R&D Intelligence in the Age of Geopolitical AI.

eBook

Securing R&D Intelligence in the Age of Geopolitical AI

The post Research security is national security. appeared first on Digital Science.


from Digital Science https://ift.tt/MO0QxRe

Featured Post

Dr. Sang-Hoon Park | Energy | Best Researcher Award

  The Global Scholar Awards proudly congratulate Dr. Sang-Hoon Park on earning the Best Researcher Award in Energy . This distinguished re...

Popular